USA
one of the most unequal countries in relation
to income in the developed world
researched
Factors of inequality
History
Income
Taxation system
Social welfare
Housing
Education
Healthcare
Effects of inequality
Housing/Homelessness
Education
Social mobility
Healthcare
Community life and social relationship
Mental health
Drug use
Obesity
Teenage pregnancy
Life expectancy
Environment
Waste production
Pollution
Cycling
Deforestation
Violence
Sources
BBC
Equality trust
Book: The Spirit Level by Richard Wilkinson and Kate Pickett
Book: The equality effect
Wikipedia
recommended documentary
Inequality for All by Robert Reich
Factors of inequality
History – a chronology of key events
1565 – The first permanent European settlement is established in North America, present-day Florida.
17th-18th centuries – Hundreds of thousands of Africans were brought over and sold into slavery to work on cotton and tobacco plantations.
1917-18 – World War I in which the US intervened significantly.
1929-33 – 13 million people became unemployed after the Wall Street stock market crash of 1929. This triggered what became known as the Great Depression.
1941 – Following the Japanese attack on Pearl Harbor, the US declared war on Japan and thereafter intervened on a massive scale in World War II.

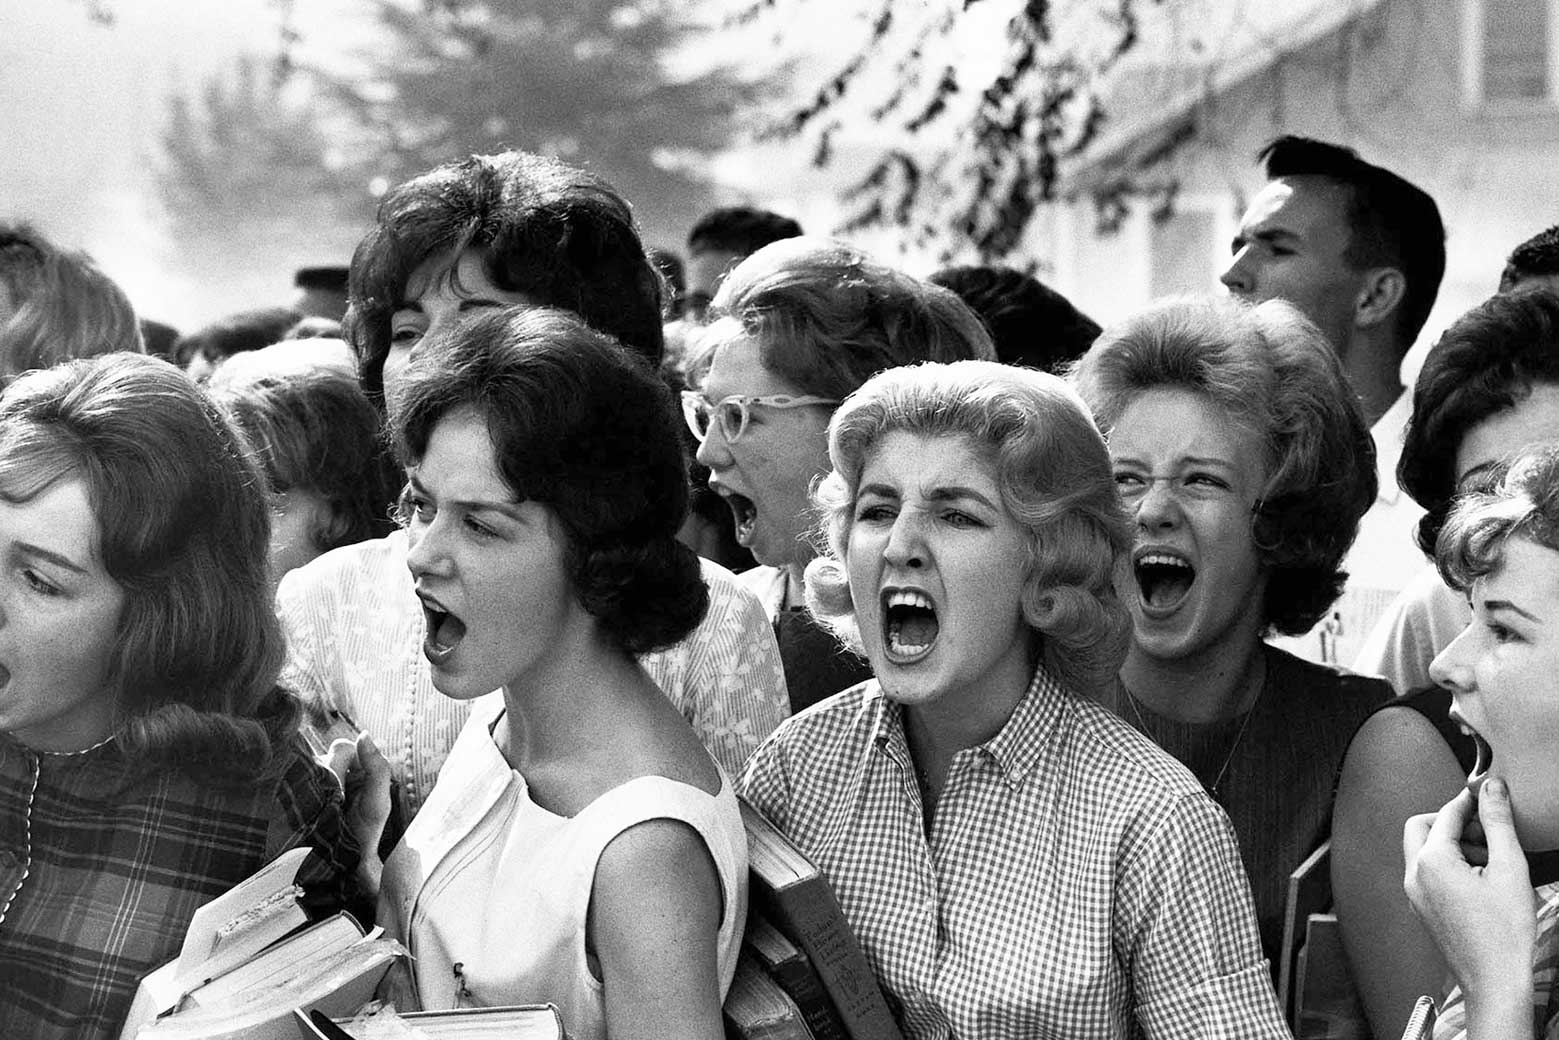
1954 – The Racial segregation in schools became unconstitutional. (on the picture: a group of teenage girls scream obscenities at black students entering their high school in Montgomery, Alabama.)
1991 – 2004 The US forces played a dominant role in the war against Iraq and Afghanistan.
2008 September – marks the beginning of the worst financial crisis since the Great Depression. With the collapse of the major Wall Street investment bank Lehman Brothers and other big US financial players hundreds of billions of dollars were wiped out in bad loans and prolonged property slumps.
Income
Income inequality in the United States is the extent to which income is distributed in an uneven manner among the American population. The inequality has increased significantly since the 1970s after several decades of stability.
Deutsche Bank Chief Economist Torsten Sløk says that the distribution of household wealth in America has become even more disproportionate over the past decade, with the richest 10% of U.S. households representing 70% of all U.S. wealth in 2018.
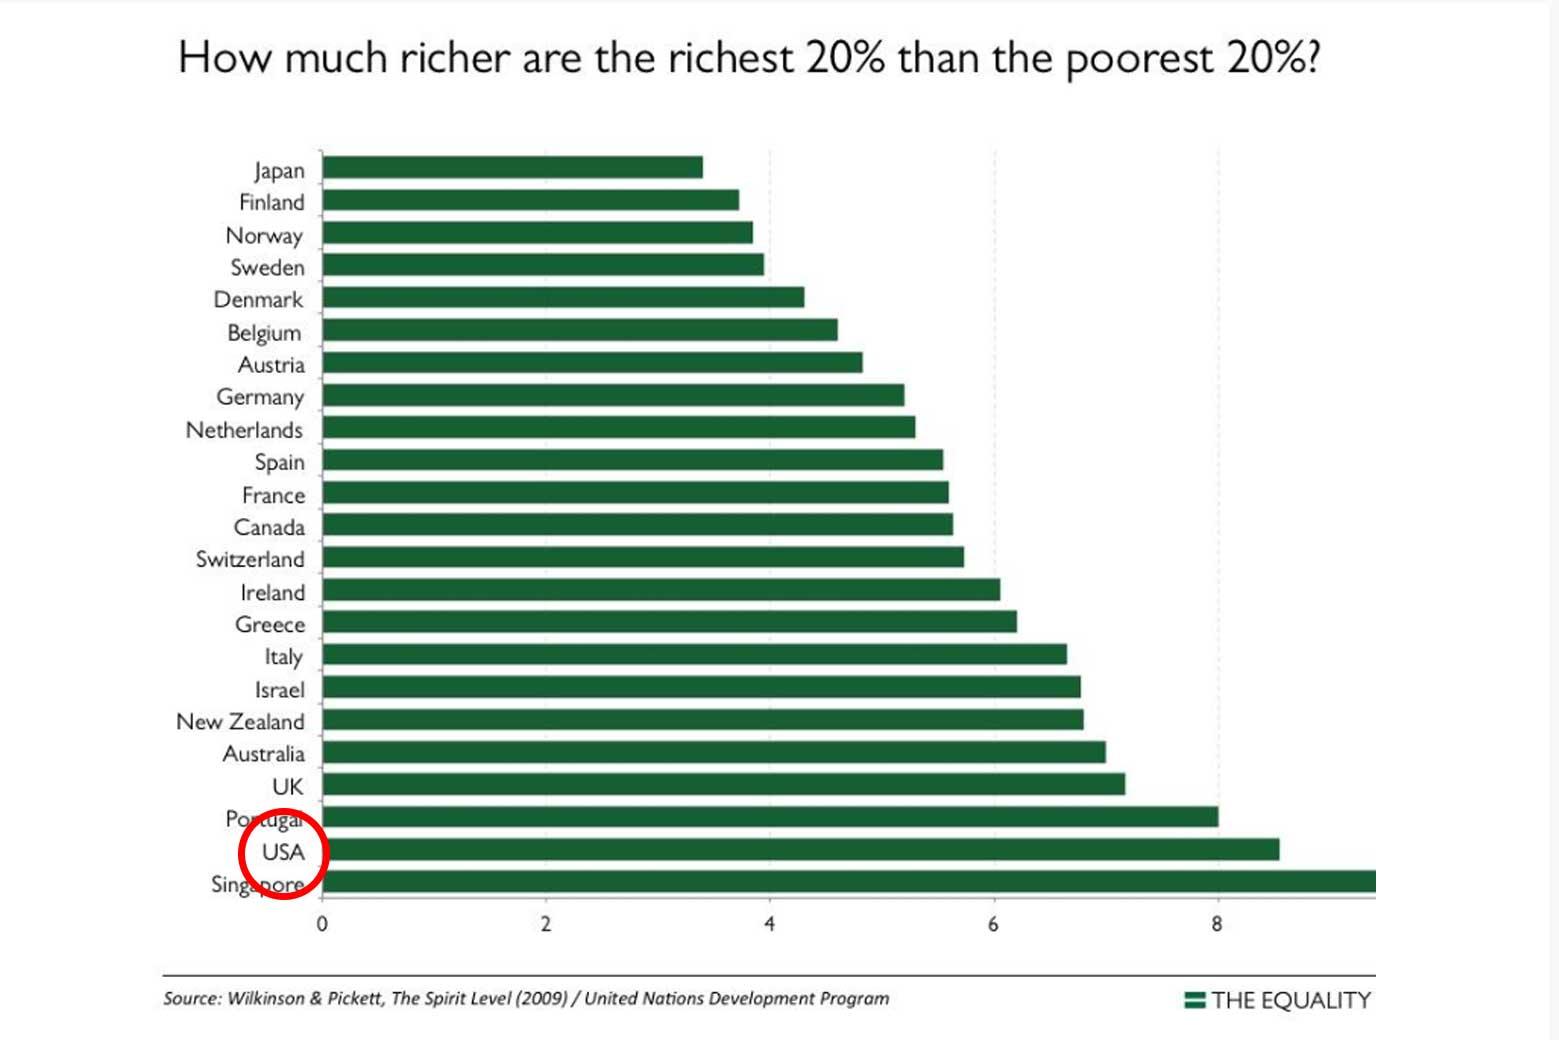
Income gap graph from the book Spirit Level page 17
A simple way to measure inequality is by looking at the share of income received by the highest-income people. The following graph shows how the size of income differences varies from one developed country to another. The length of the horizontal bar shows how much richer the richest 20 percent of the population is in each country compared to the poorest 20 percent. The US are at the bottom of the chart where the richest 20 percent get about 9 times as much as the poorest.
(The figures are for household income, after taxes and benefits, adjusted for the number of people in each household)
Tax system
Governments can intervene to promote equity, and reduce inequality and poverty, through the tax and benefit system. This means employing a progressive tax and benefits system which takes proportionately more tax from those on higher levels of income, and redistributes welfare benefits to those on lower incomes.
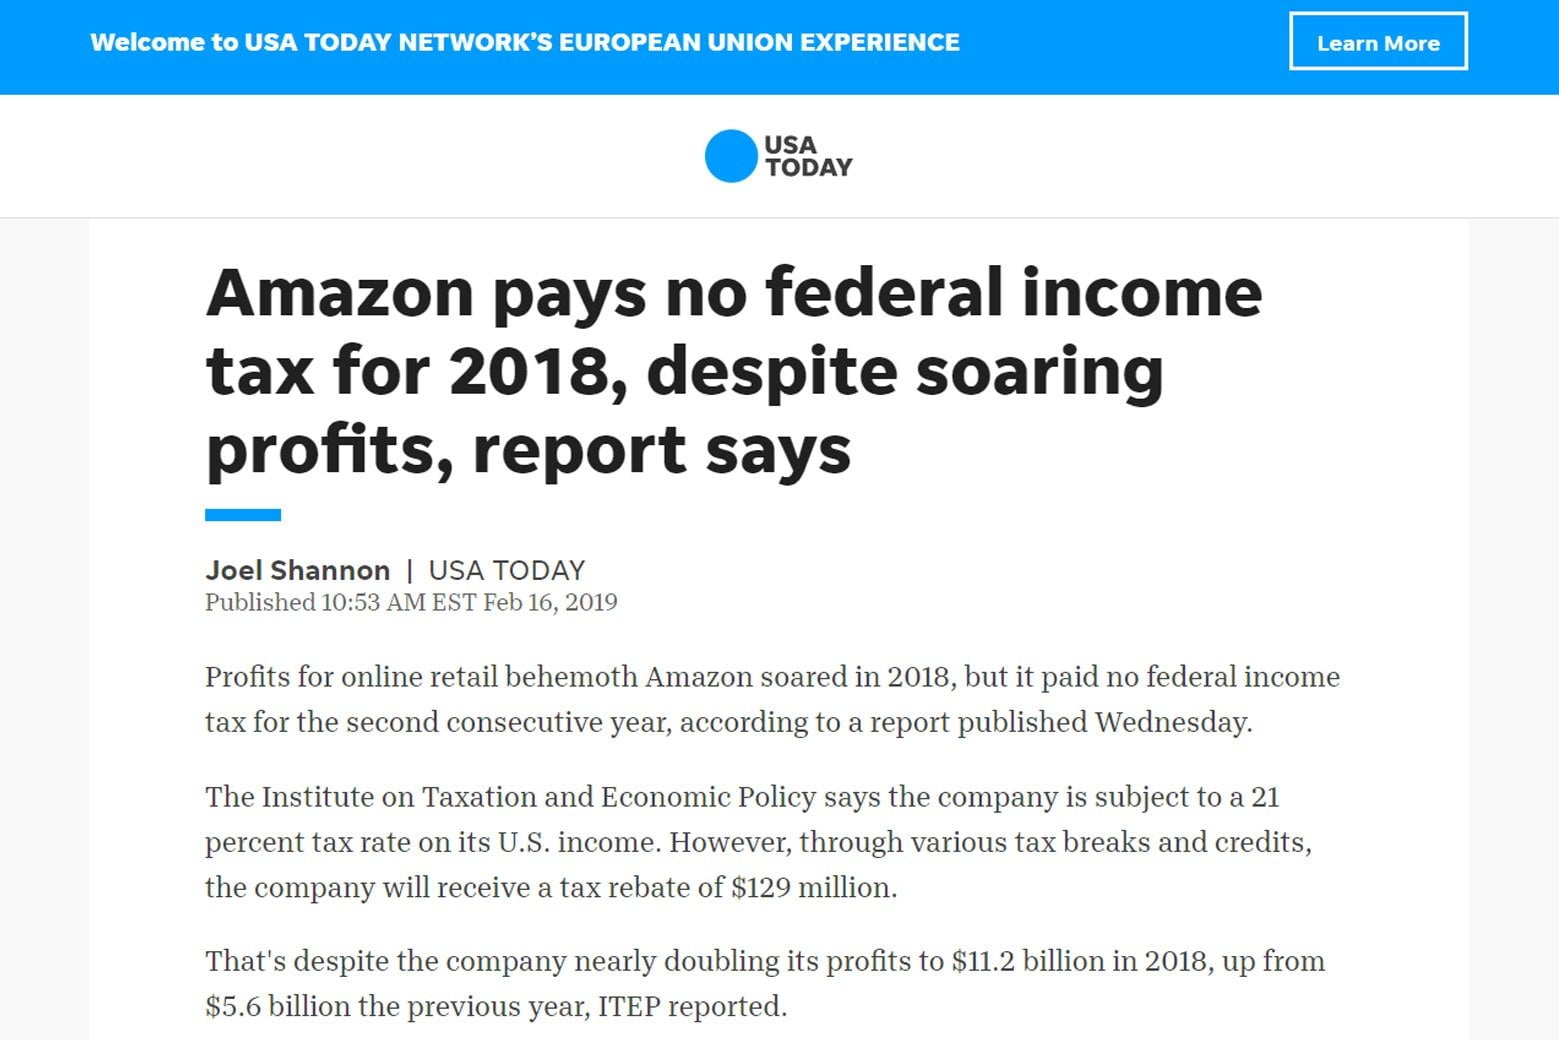
Unfortunately, the US taxation system makes it easier for wealthy people and corporations to pay less taxes.
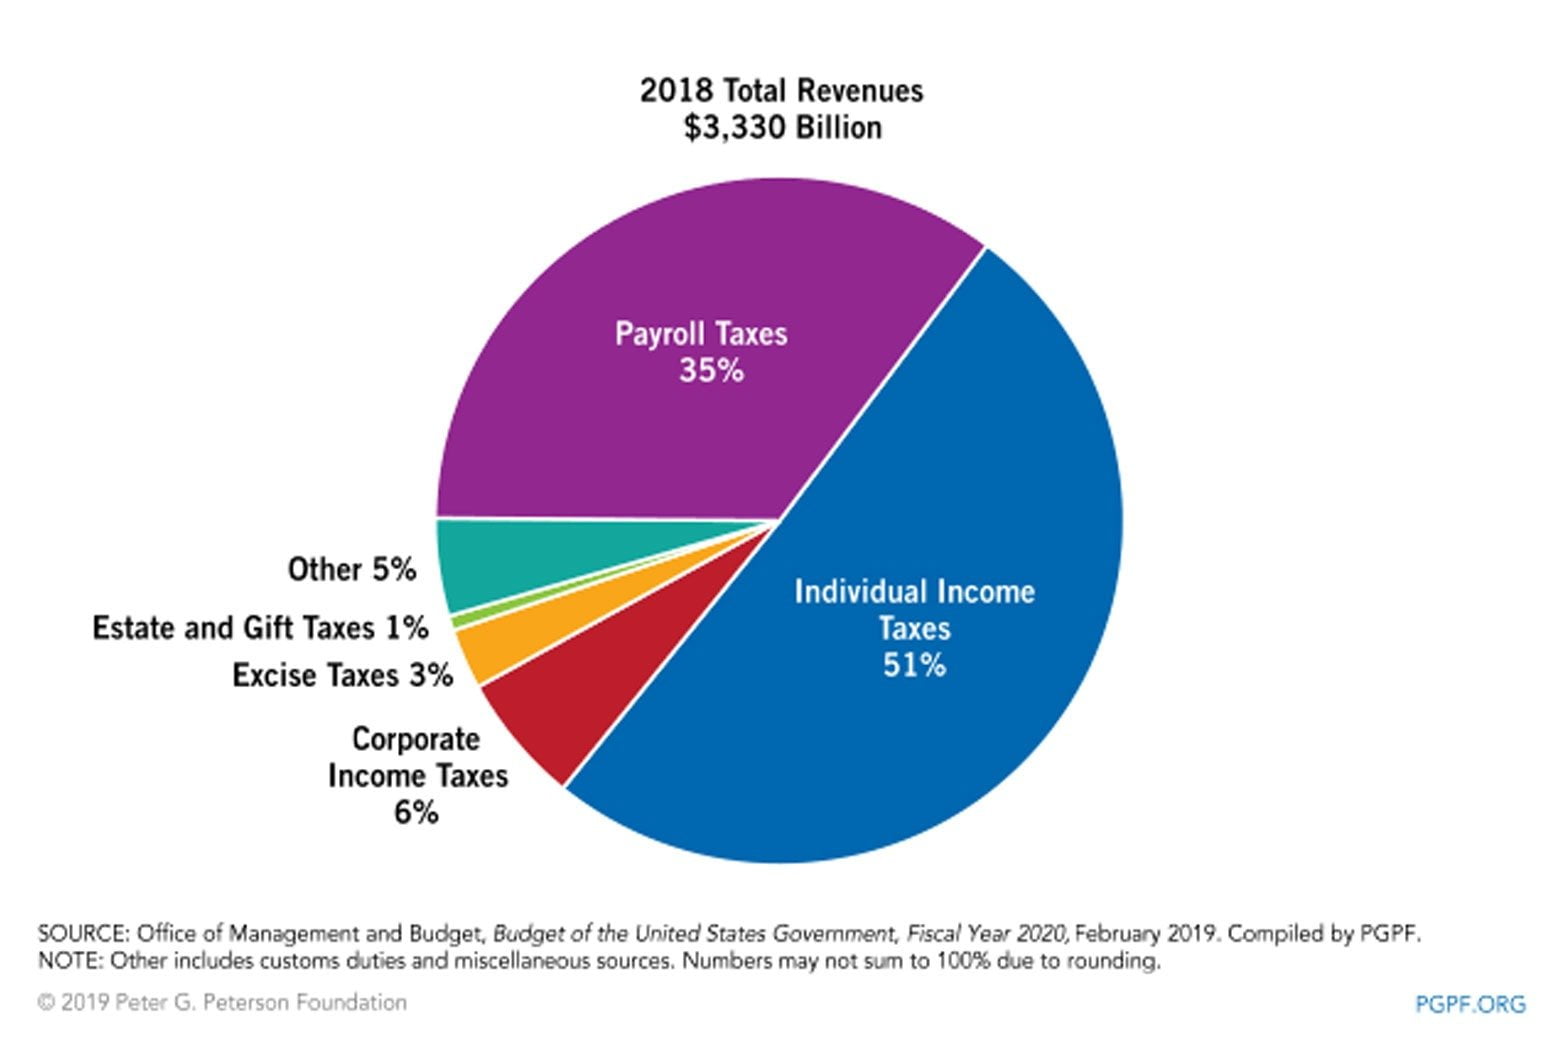
The federal government revenues chart shows the various income sources of the US government (see pie chart below).
As you can see, most of the US government’s income in generated by the individual income tax and the social security/payroll tax. Citizens pay altogether 86 % of their income to the government.
Very much in contrast to this, corporations contribute with only 6 % to the US government overall revenues, although they are generating much more income than the population.
tax avoidance
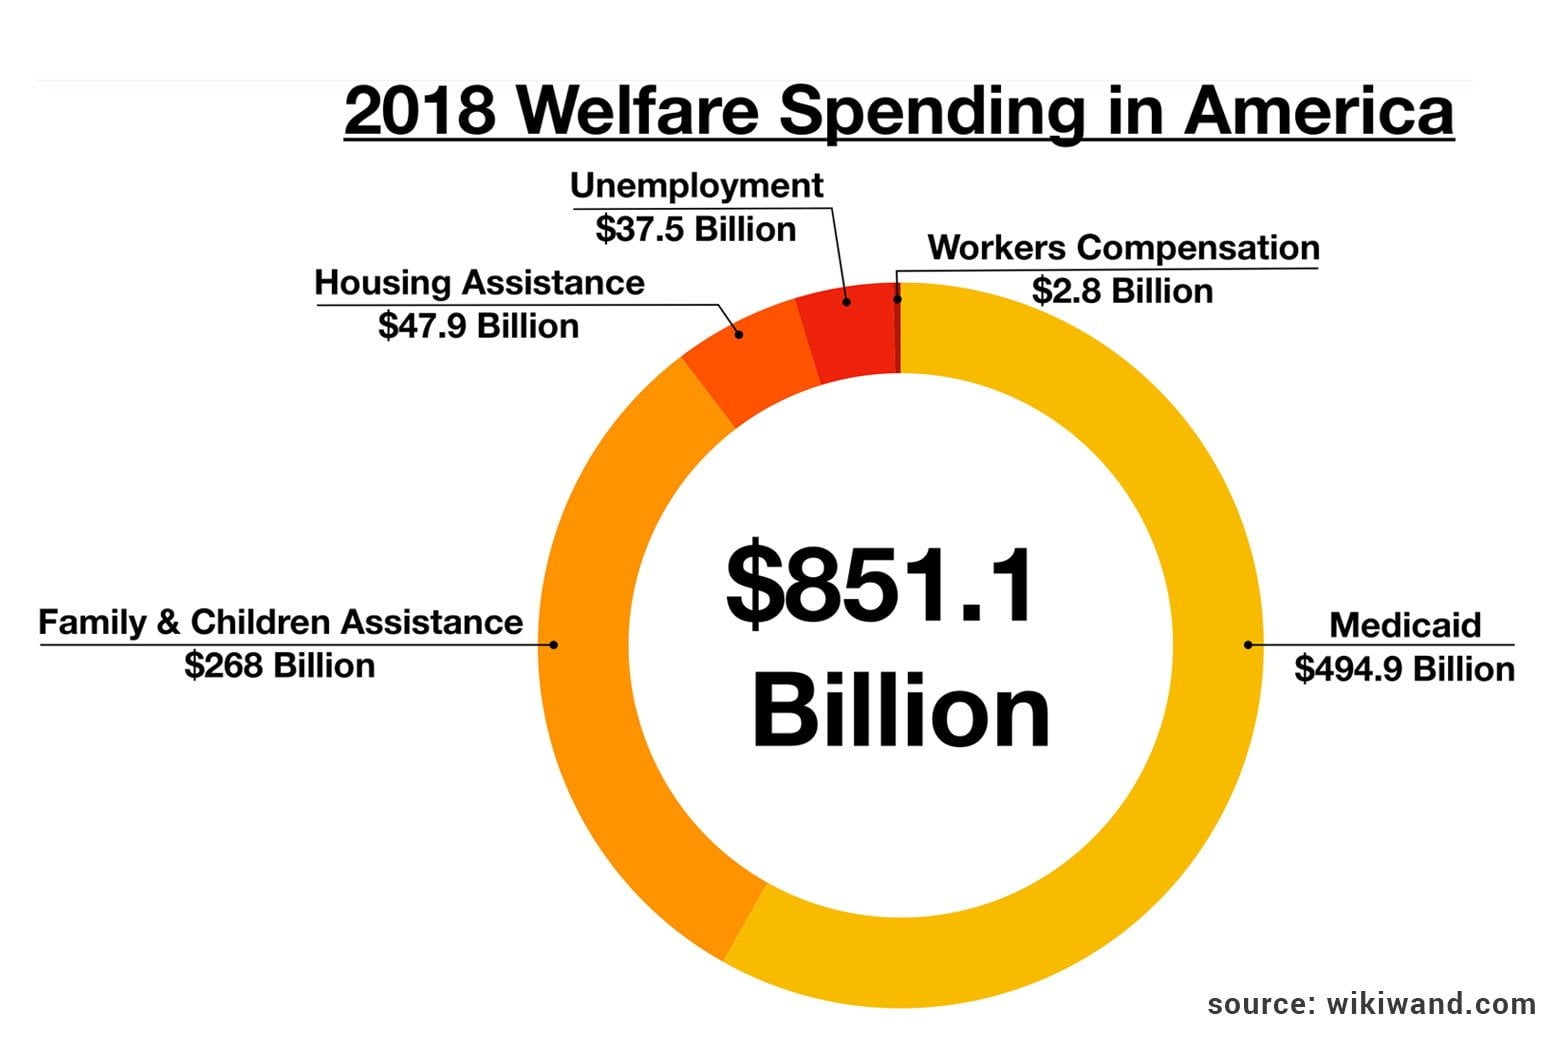
Social welfare system
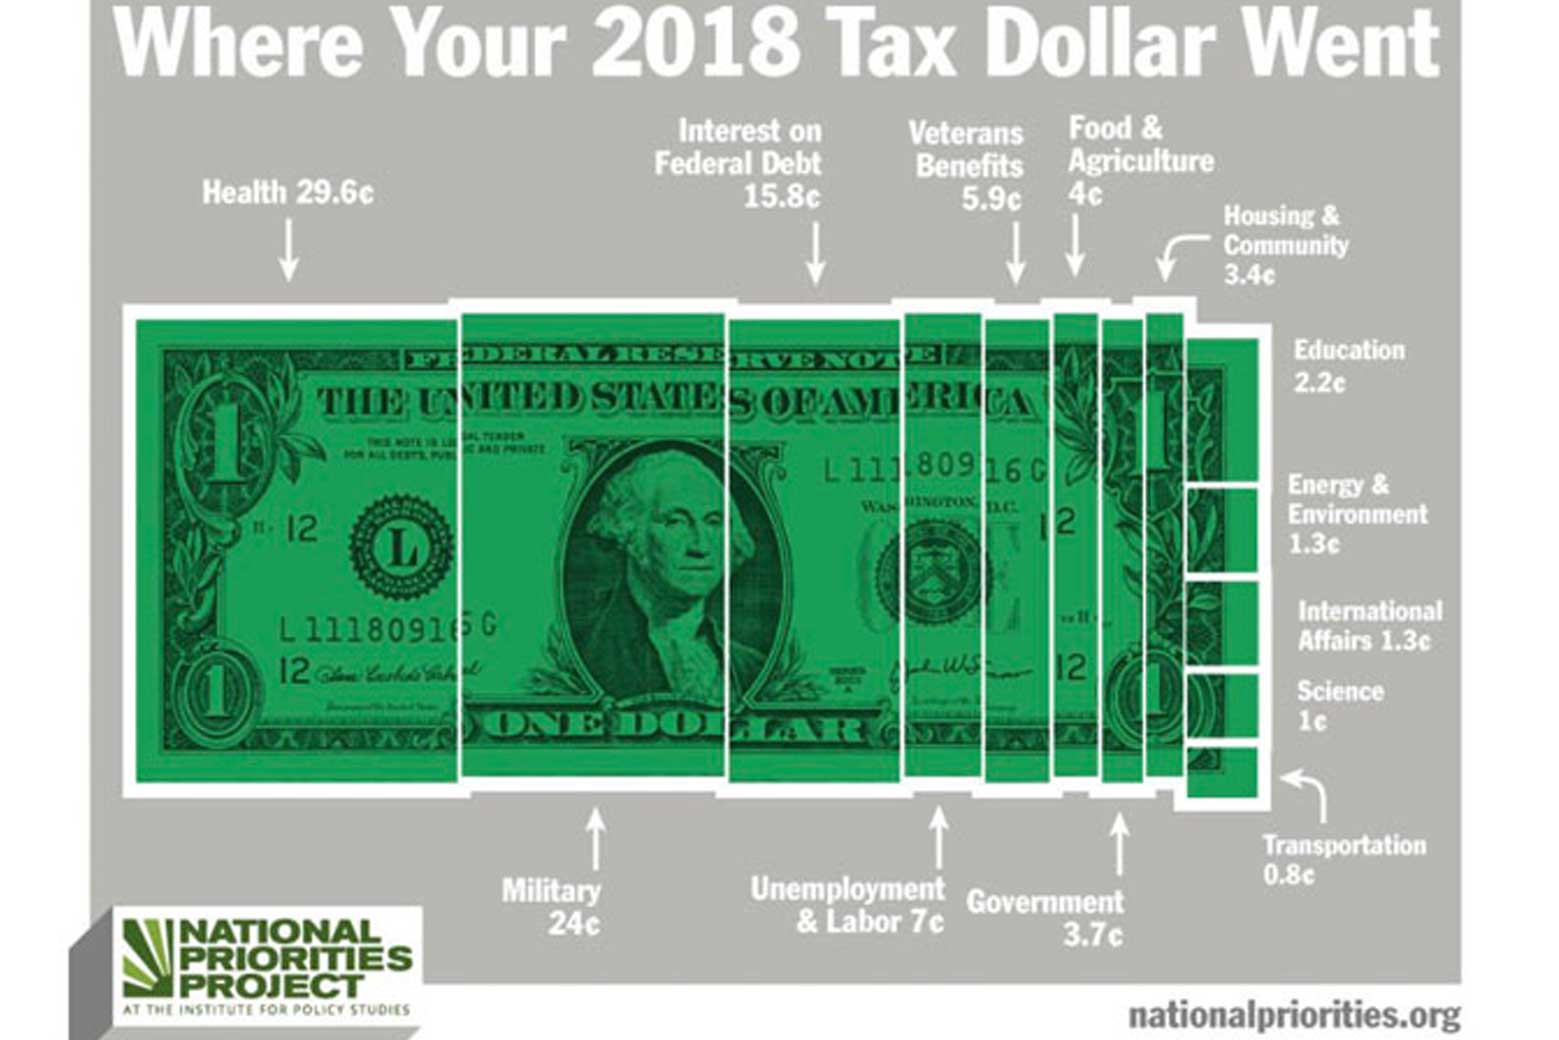
The chart below shows how the US government reinvest the money it gets through its taxation system.
Most of the government’s income is reinvested into healthcare. Interestingly, the US government spends far more on military than on housing and education.
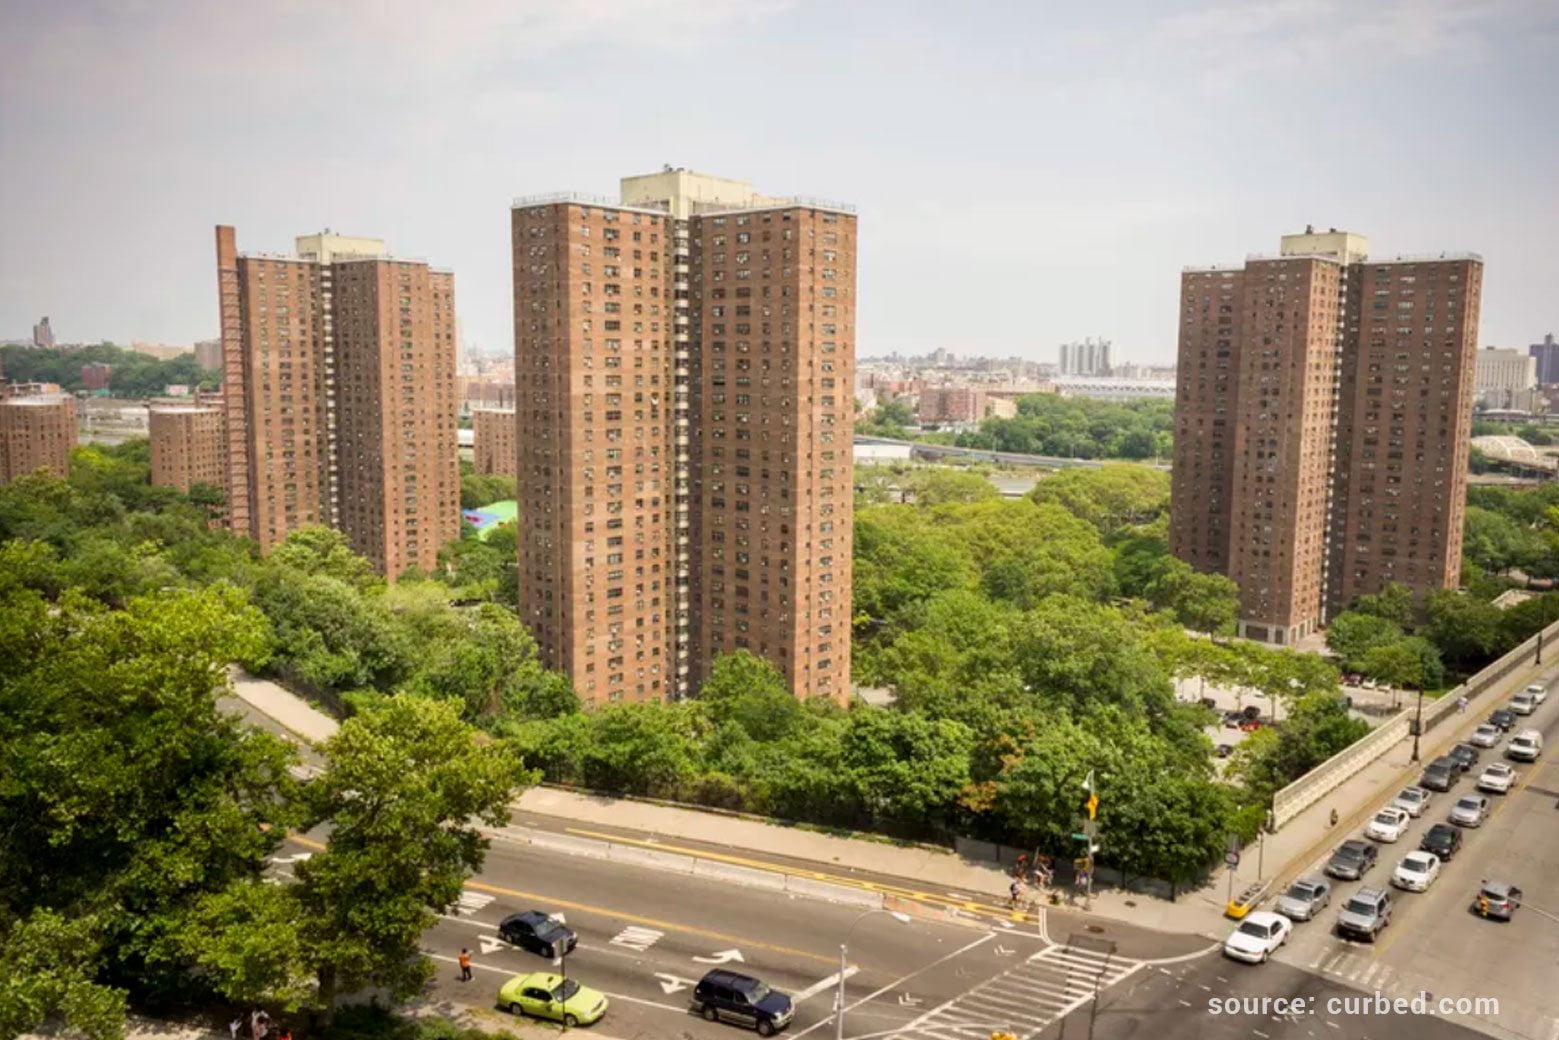
Access To Housing
Increasing rents and stagnating wages have made it harder for families to keep a roof over their heads. Yet, funding for rental assistance has fallen sharply over the last six years. US public housing, often referred to as “ housing projects” makes up 2% of the nation’s homes – but with high concentrations in big cities – it is often referred to as “the housing of last resort”.
Generally speaking, the United States is facing an affordable housing crisis. Only 37 affordable and available rental homes exist for every 100 extremely low-income households.
Access to education
The education system in the United States is one of the most unequal systems in the developed world as it is dependent on the person’s social status. Students coming from upper-class families have the means to access high-quality resources to prepare them for college, a significant advantage for ensuring success in the university admissions process.
Although each state has a similar structure to finance their schools, each establishment can supplement this by raising funds locally. Consequently, schools located in wealthy areas have the potential to receive significantly more private funding than schools located in poorer regions and neighborhoods. Schools benefiting from significant funding can employ more competent teachers, provide more up-to-date textbooks, equip classrooms better which have an everyday impact on the academic development of students.
While primary education from kindergarten to grade 12 is free, the average student loan debt for higher education amounted to $28,565 in 2018. This causes an overwhelming weight on students’ shoulders: success in their chosen career path followed by paying back their debt. Consequently, many people who come from the middle-class are not in a position to repay their completely debts until they are 40 or 50.

Access to Healthcare
Unlike most developed nations, the US health system does not provide healthcare to the country’s entire population; instead, most citizens are covered by a combination of private insurance and various federal and state programs.
Employers are the primary source of health insurance in the United States, covering 120 million people. But the government provides coverage to a large number of Americans both as an employer (39.2 million for Federal, State and Local government employees, including the military) and through public insurance programs such as Medicare (39 million) and Medicaid (41 million).
Nevertheless, about 2,5 million people remain uninsured and hence without medical care because they do not meet the eligibility criteria to access Medicaid, nor those of the health insurance marketplace.
Effects of inequality
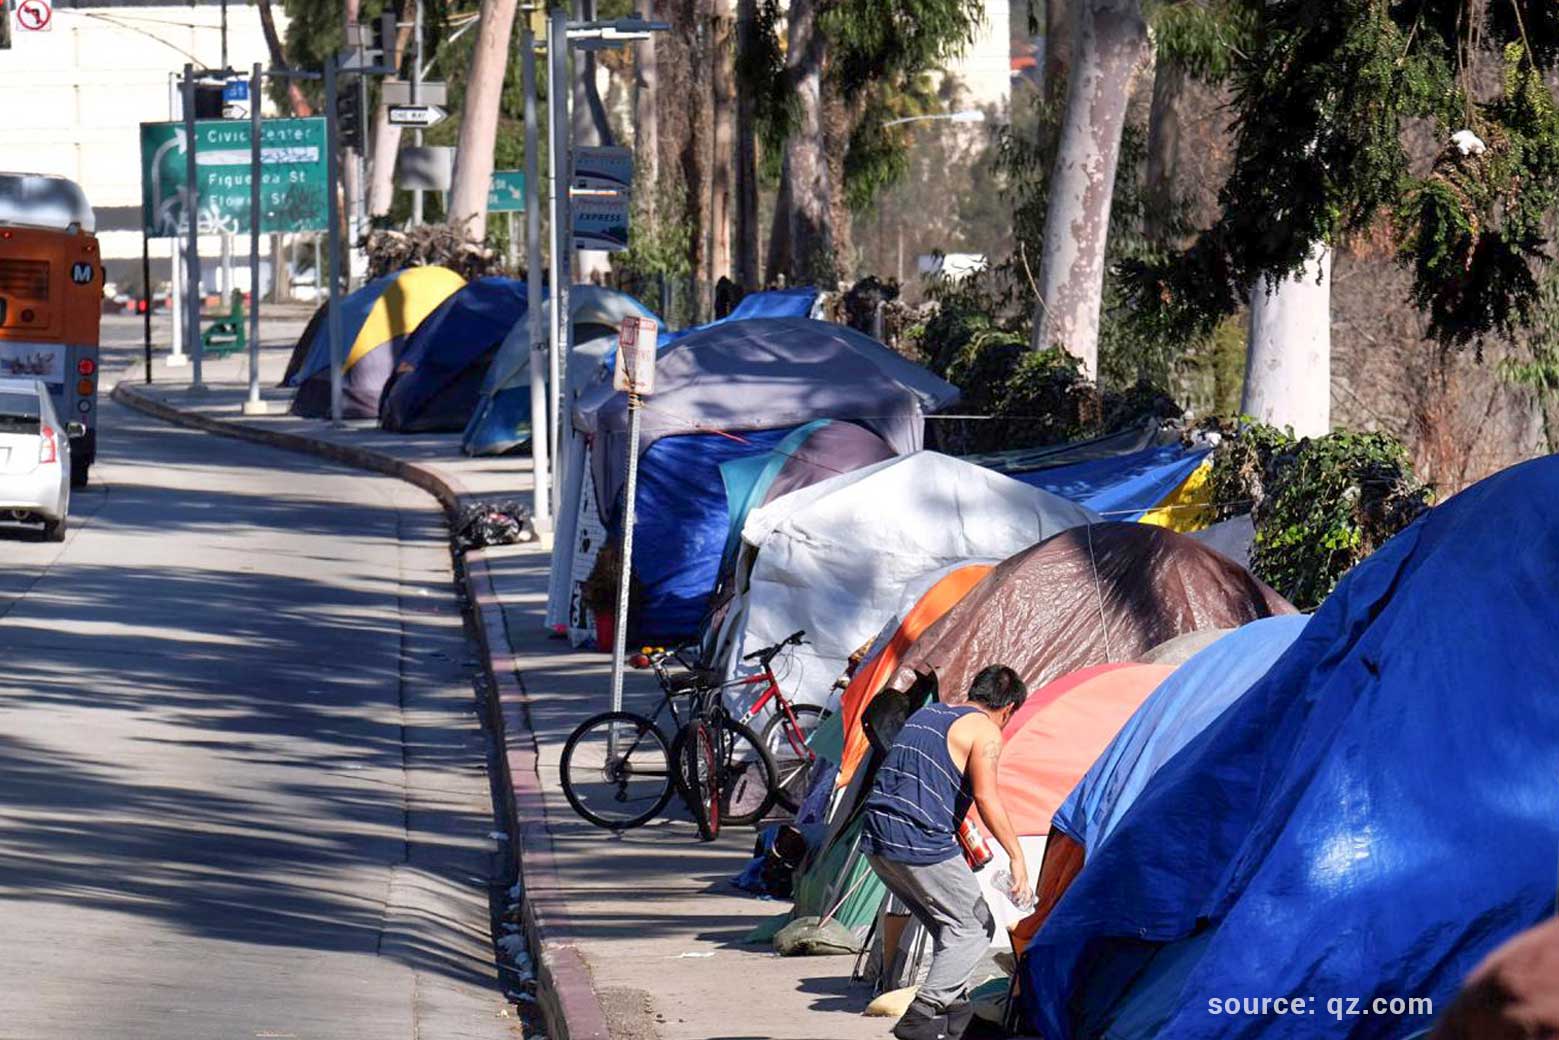
Homelessness
Inequality is the most consistently identified cause of homelessness. Out of every 10,000 people in the United States, 17 experienced homelessness on a single night in 2018.
Education
Evidence has established that income equality is a factor that affects educational performance. The graph below shows that the reading and maths scores are less high in the USA. (Graph page 106).
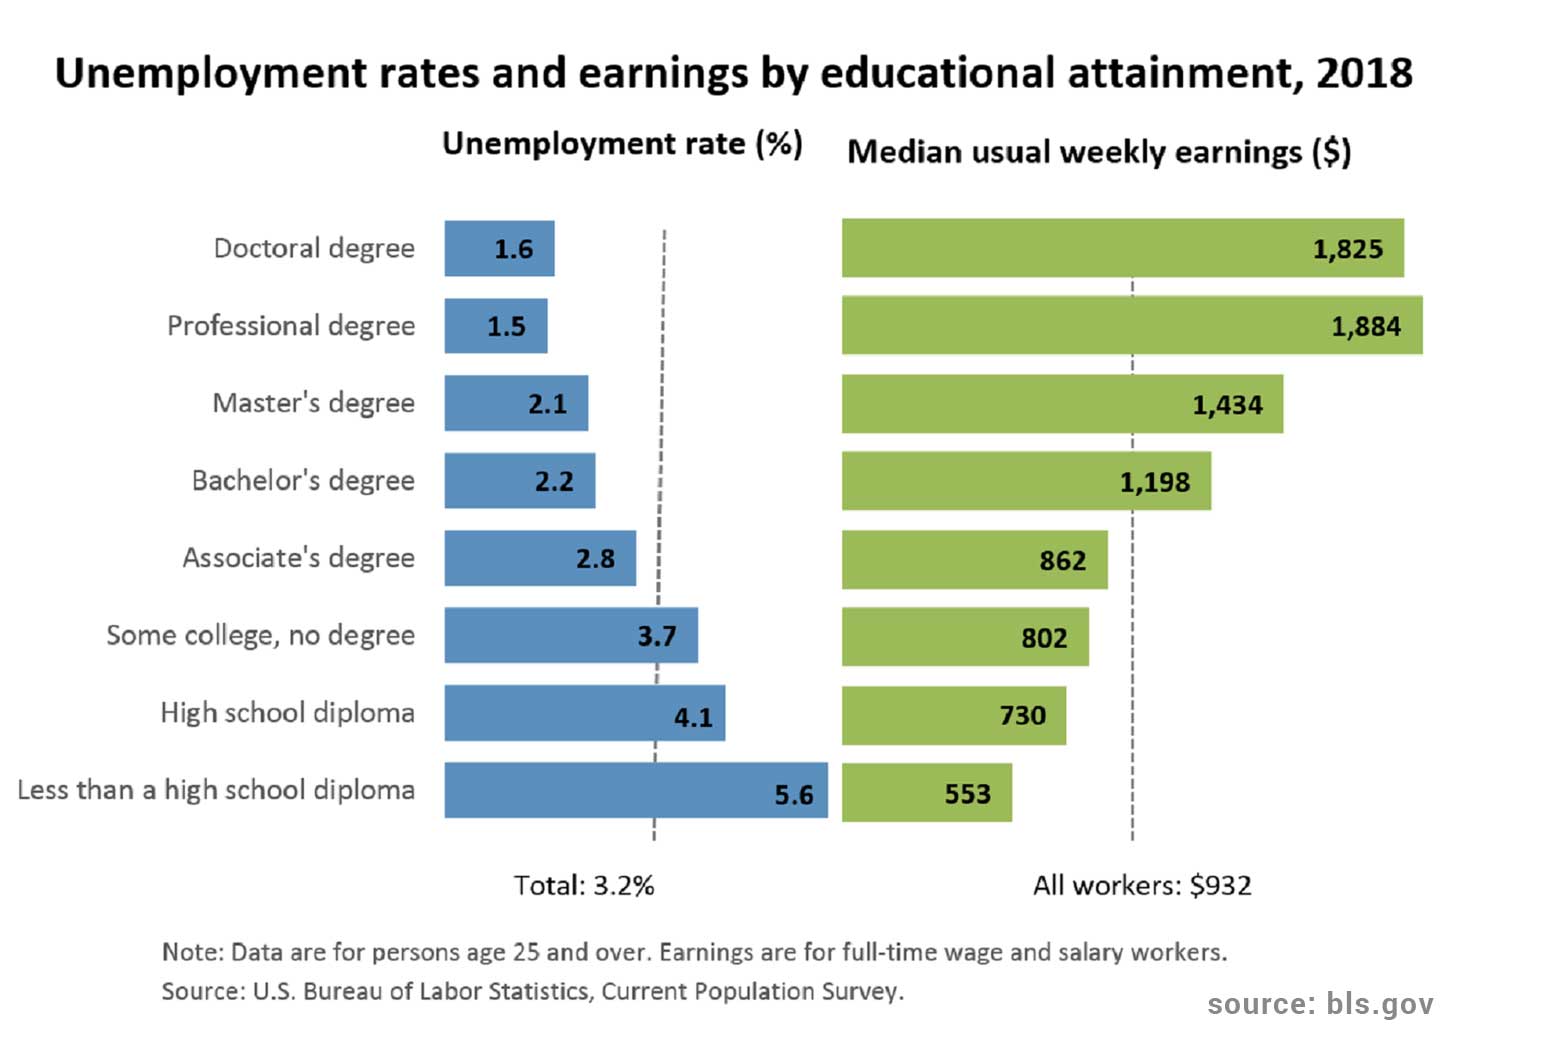
Evidence has also shown that the dropping out rate of high school is high in the US. In 2017, there were 2.1 million dropouts between the ages of 16 and 24. As access to education is dependent on social status, consequently, people with no higher education earn less and are more susceptible to become unemployed.
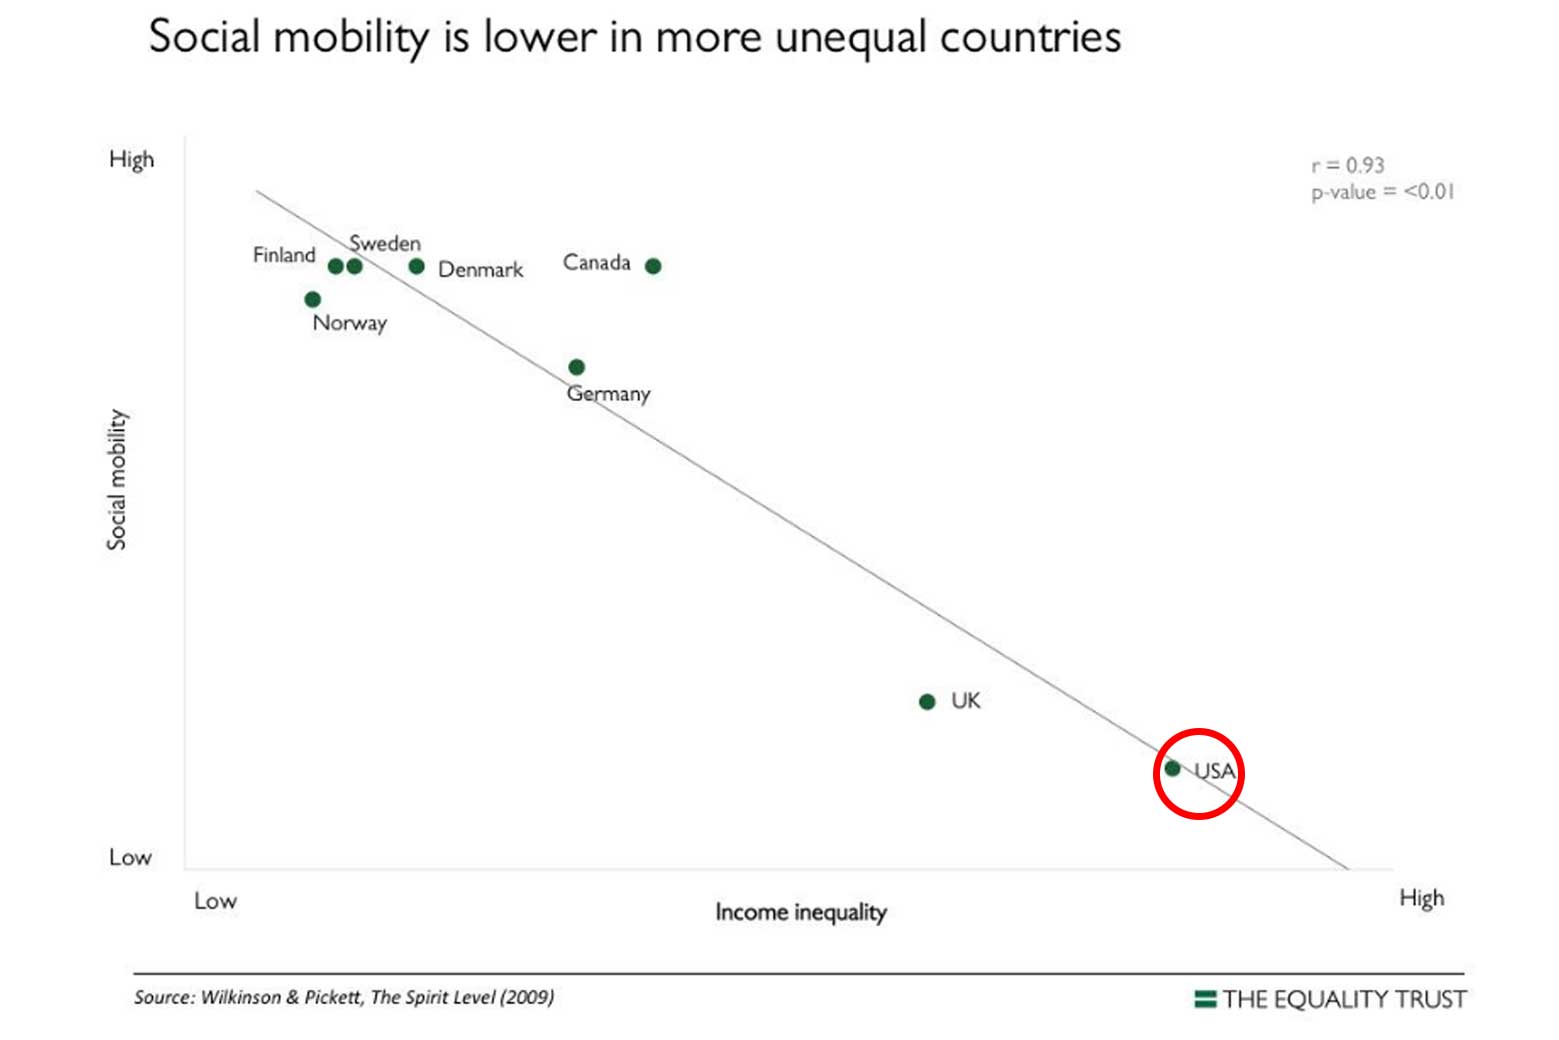
Social mobility
The possibility of social mobility is what we mean when we talk about equality of opportunities: the idea that anybody, by their own merits and hard work, can achieve a better social and economic position for themselves and their family.
Far from enabling the ideology of the American Dream, the USA has one of the lowest mobility rates. This means that one’s starting income now greatly determines economic and social mobility in the future. In an analysis by American University economist Tom Hertz, researchers found out that American children from low-income families have only 1 percent chance of reaching the top 5 percent of the income distribution compared to children of the rich who have a 22 percent chance.
Health
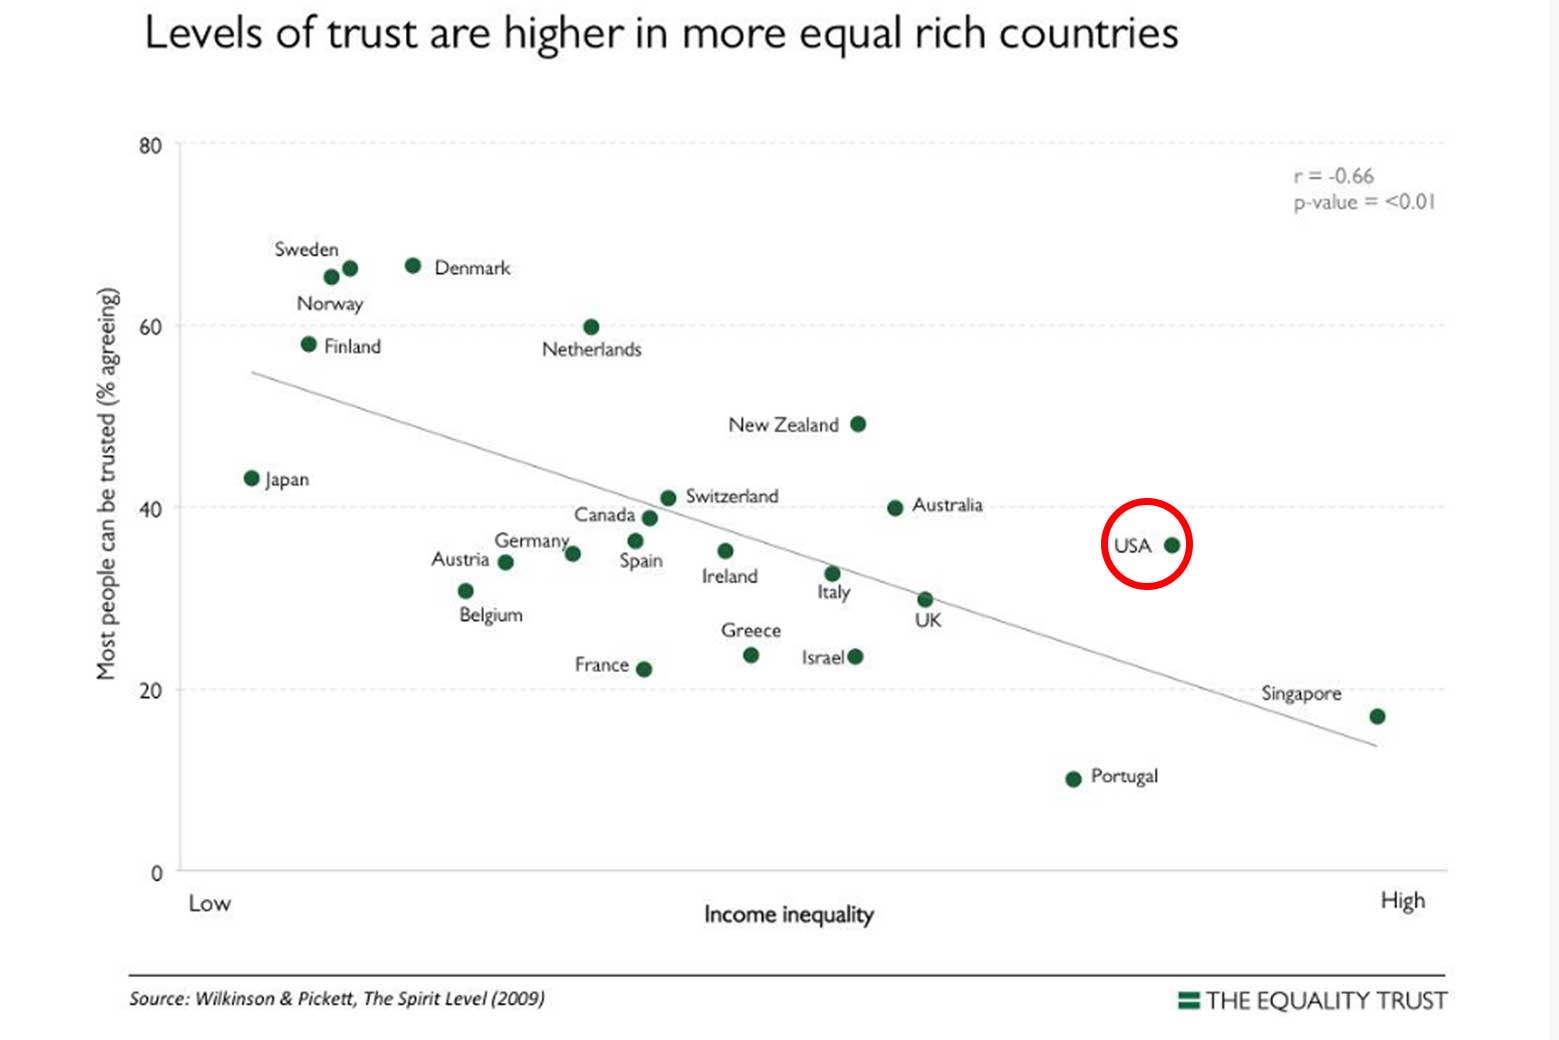
Community life and social relationships
The effect inequality has on trust is large in the USA where less than 40% of the population believe that other people can’t be trusted.
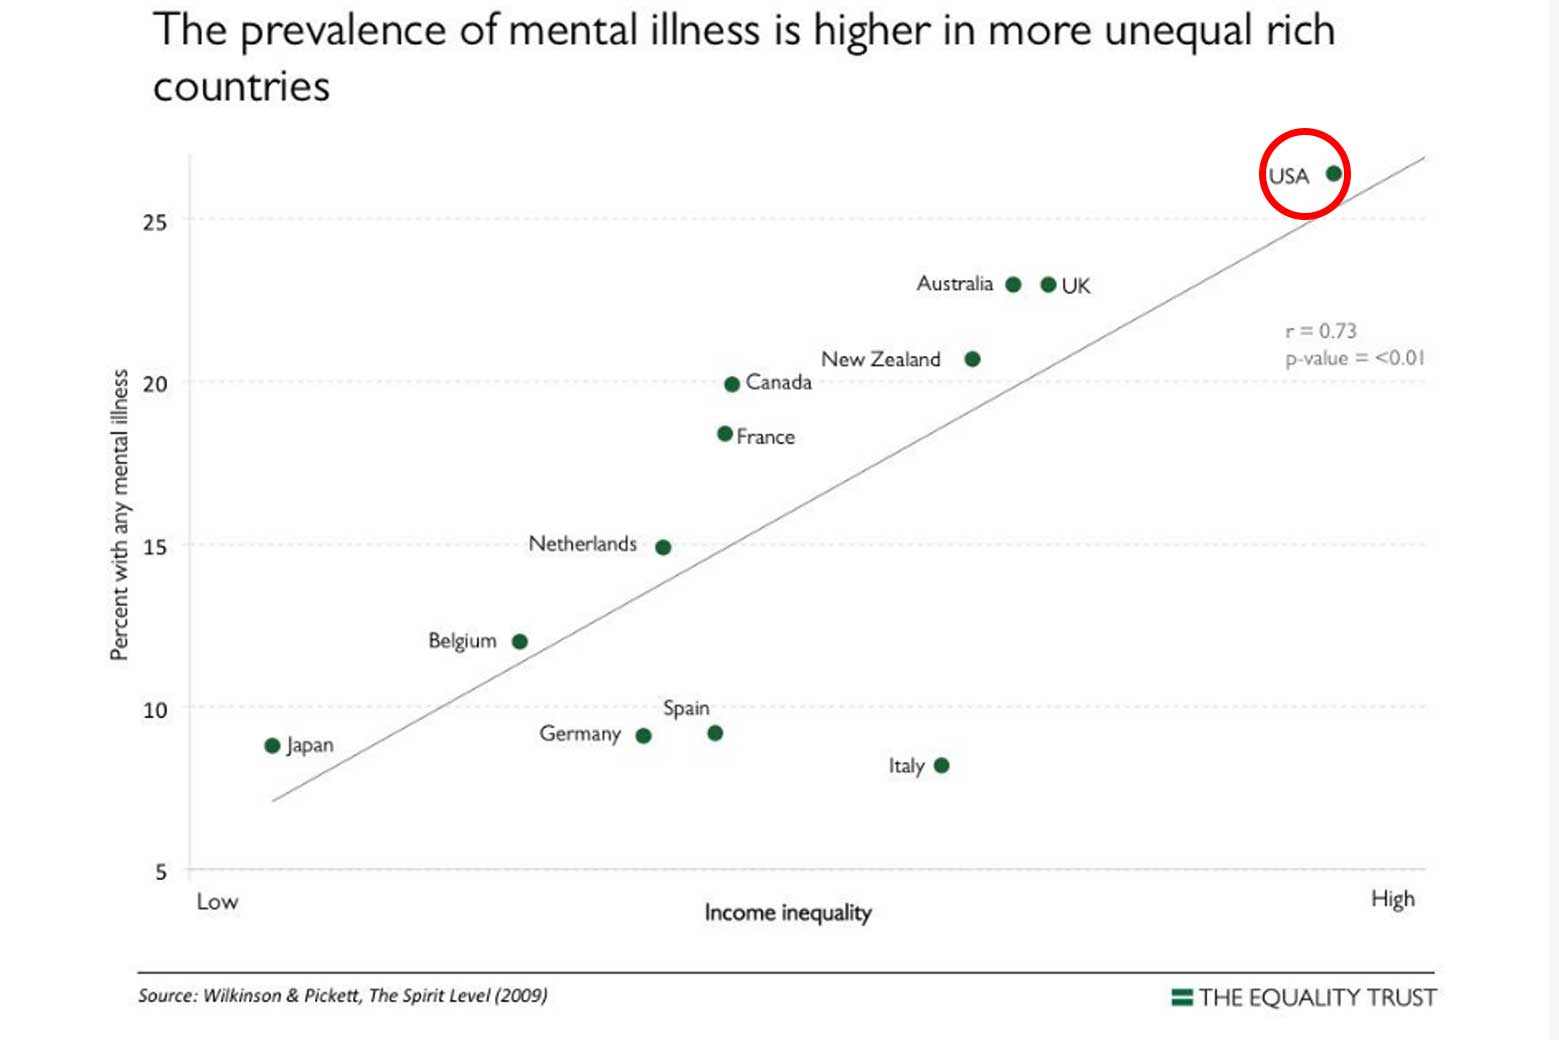
Mental health
Despite the USA spending $100 billion on mental health annually, one in four adults have been mentally ill in the past year and almost a quarter of these episodes were severe; over their lifetime more than half will suffer from a mental illness. This is linked to the prevailing income inequality in the US as the following graph shows.
Drug use
There is a strong tendency that also drug use is closely related to income inequality. The US having more people addicted to drugs and drug deaths than other countries.

Obesity
In the USA, just over 30% of the adults are obese and this again is related to income inequality. Overweight among the poor seems to be particularly strongly associated with income inequality.

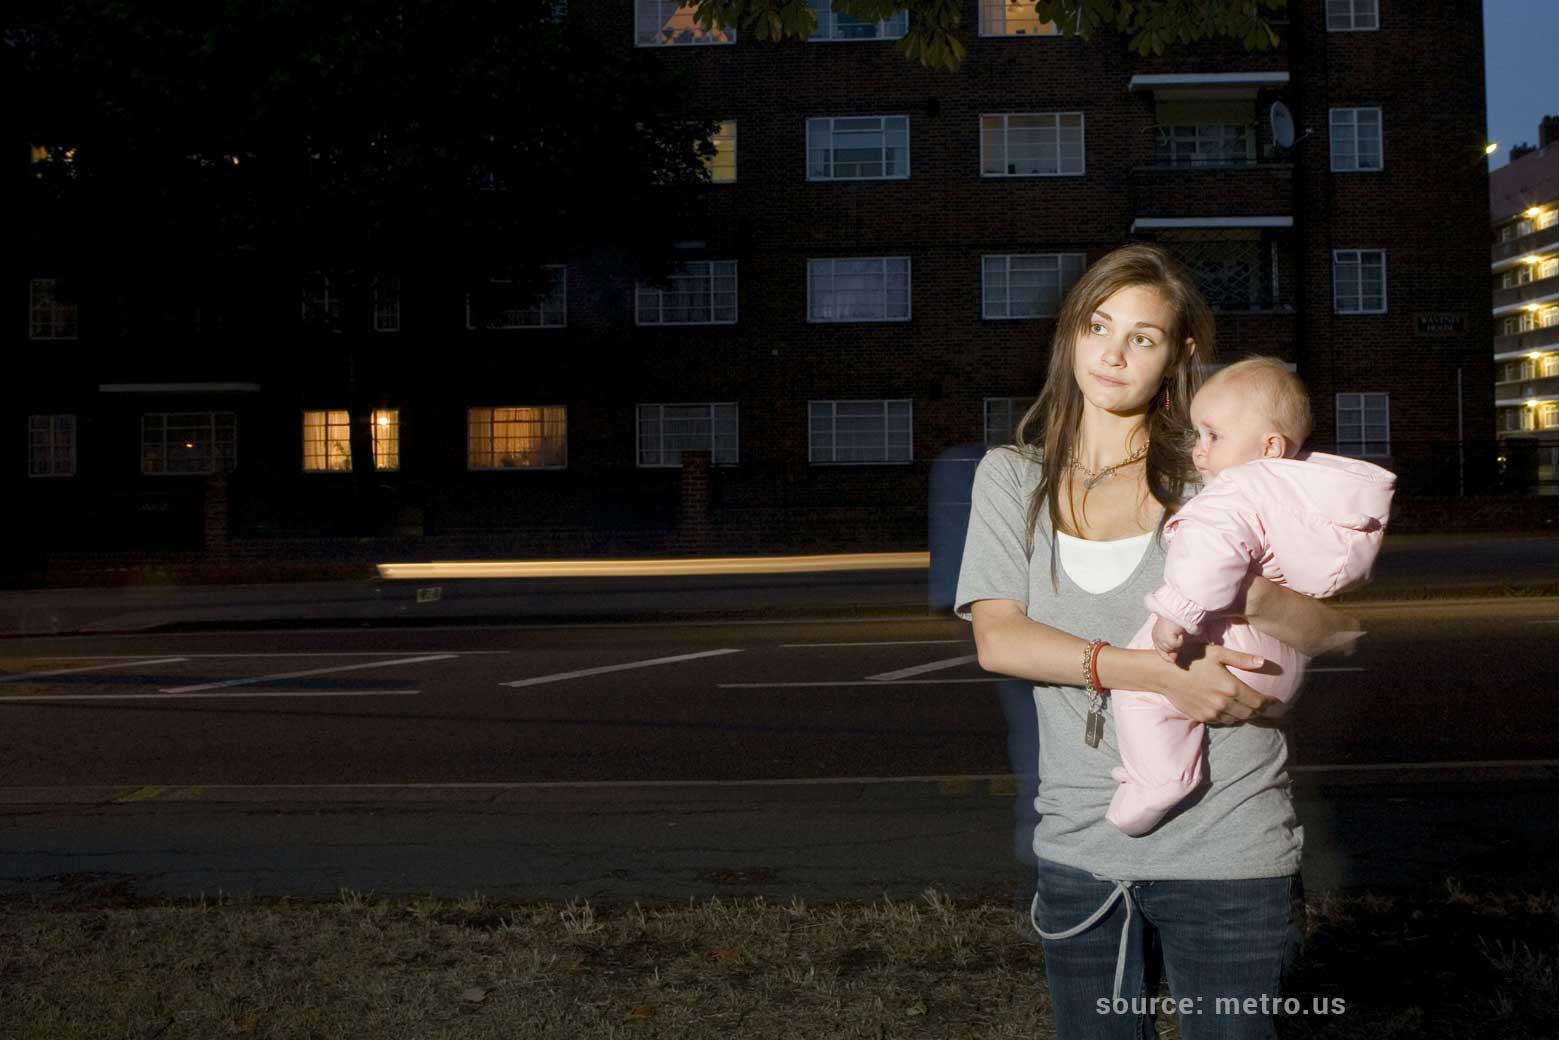
Teenage pregnancy
The USA also top the charts when it comes to teenage birth where the teenage birth rate lays by 52,1 (per 1000 women aged 15-19). The graph shows that it is linked to income inequality.
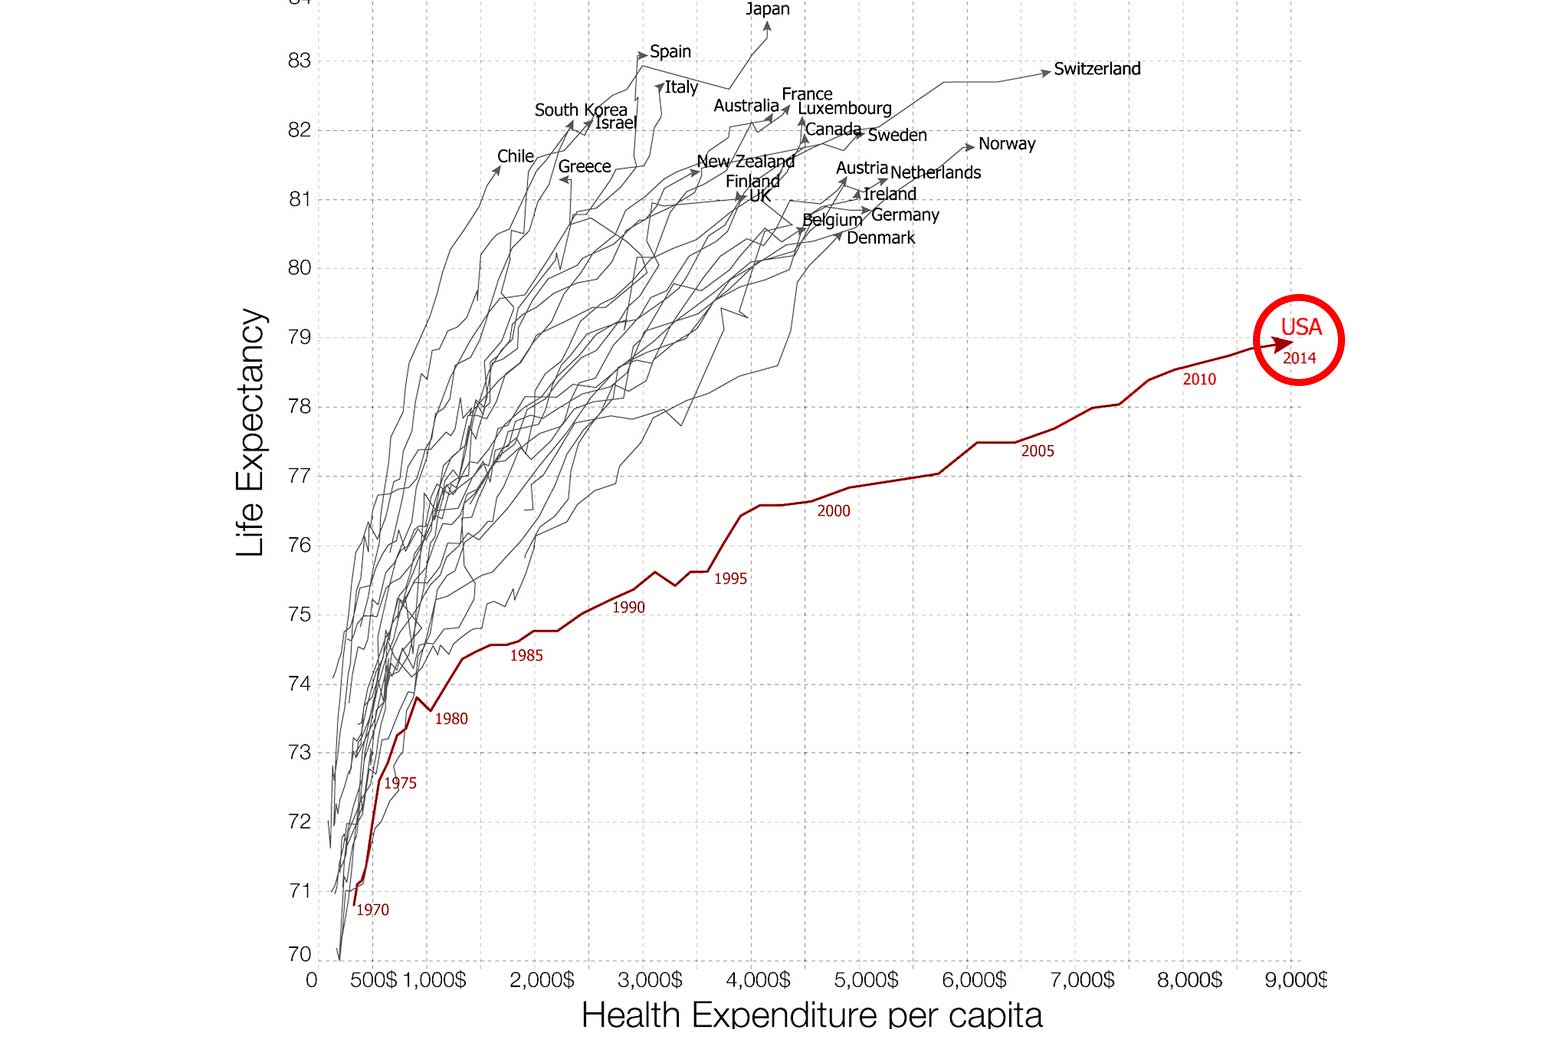
Life expectancy
Life expectancy is not linked to the amount of health spending per person. Even though the US spend between 40-50% of the world’s total spending on health care, an association to life expectancy cannot be established.
Environment
Waste production
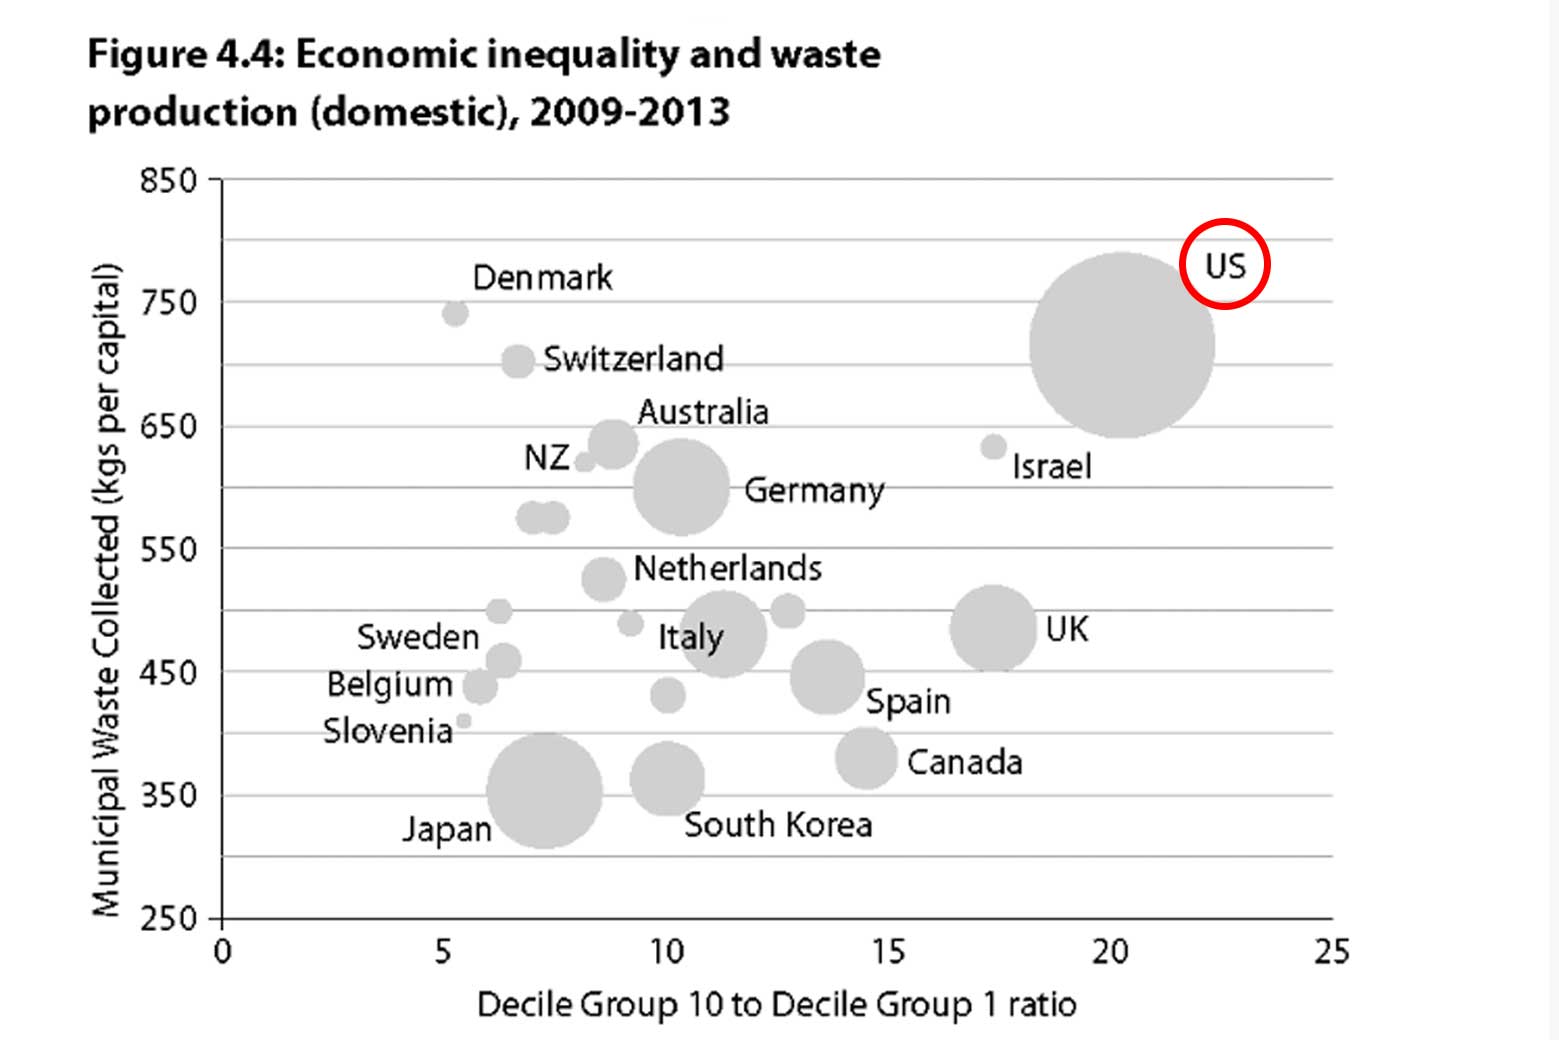
Inequality also has an impact on the waste production which is clearly shown on this bubble chart.
Countries to the right are more unequal, while countries that are high up produce more waste.
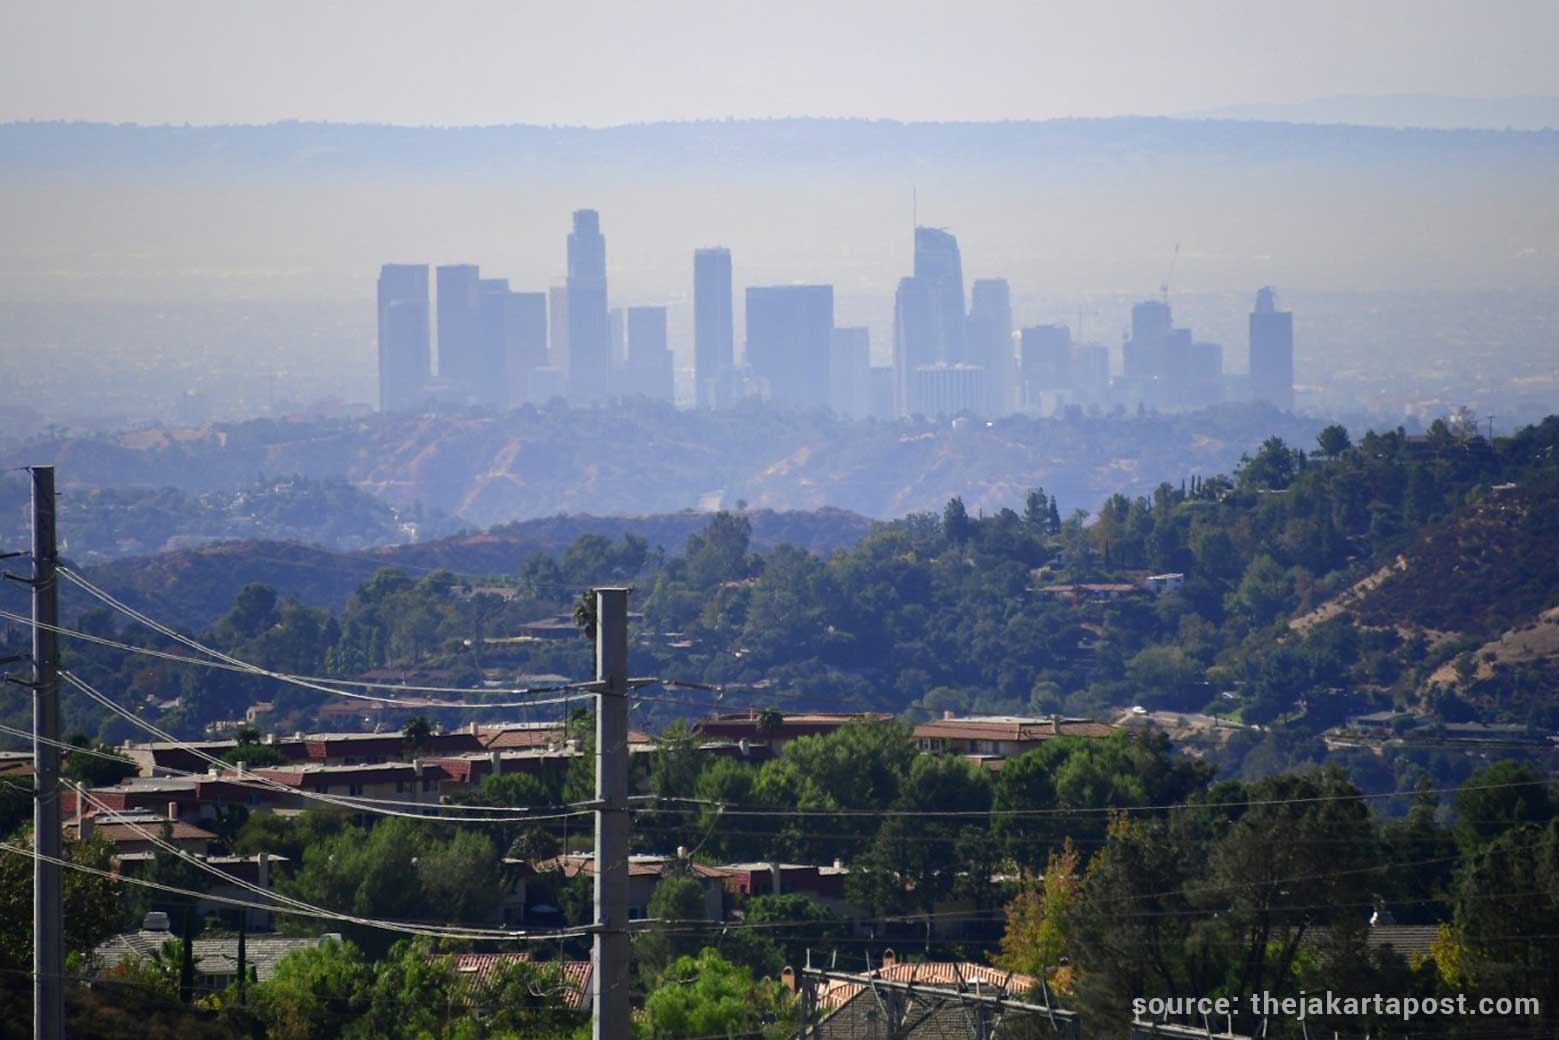
Pollution
The most damaging form of pollution is the carbon dioxide that is released. Residents of the US contribute more emissions of CO2 than any other of the richest countries on the planet which is linked to income inequality.
Driving vs cycling
The projection of the number of registered vehicles in the US for 2019 is 281.3 million. Globally, the U.S. has 30 percent of the world’s automobiles, yet it contributes about half of the world’s emissions from cars.
In comparison: with a population of 310,936,000, there are about 32,2% cyclists. In the USA only 0,9% of all trips are made by bike. The average distance cycled per person is 0.1 km according to a survey conducted by Breakaway Research Group for People for Bikes.
Deforestation
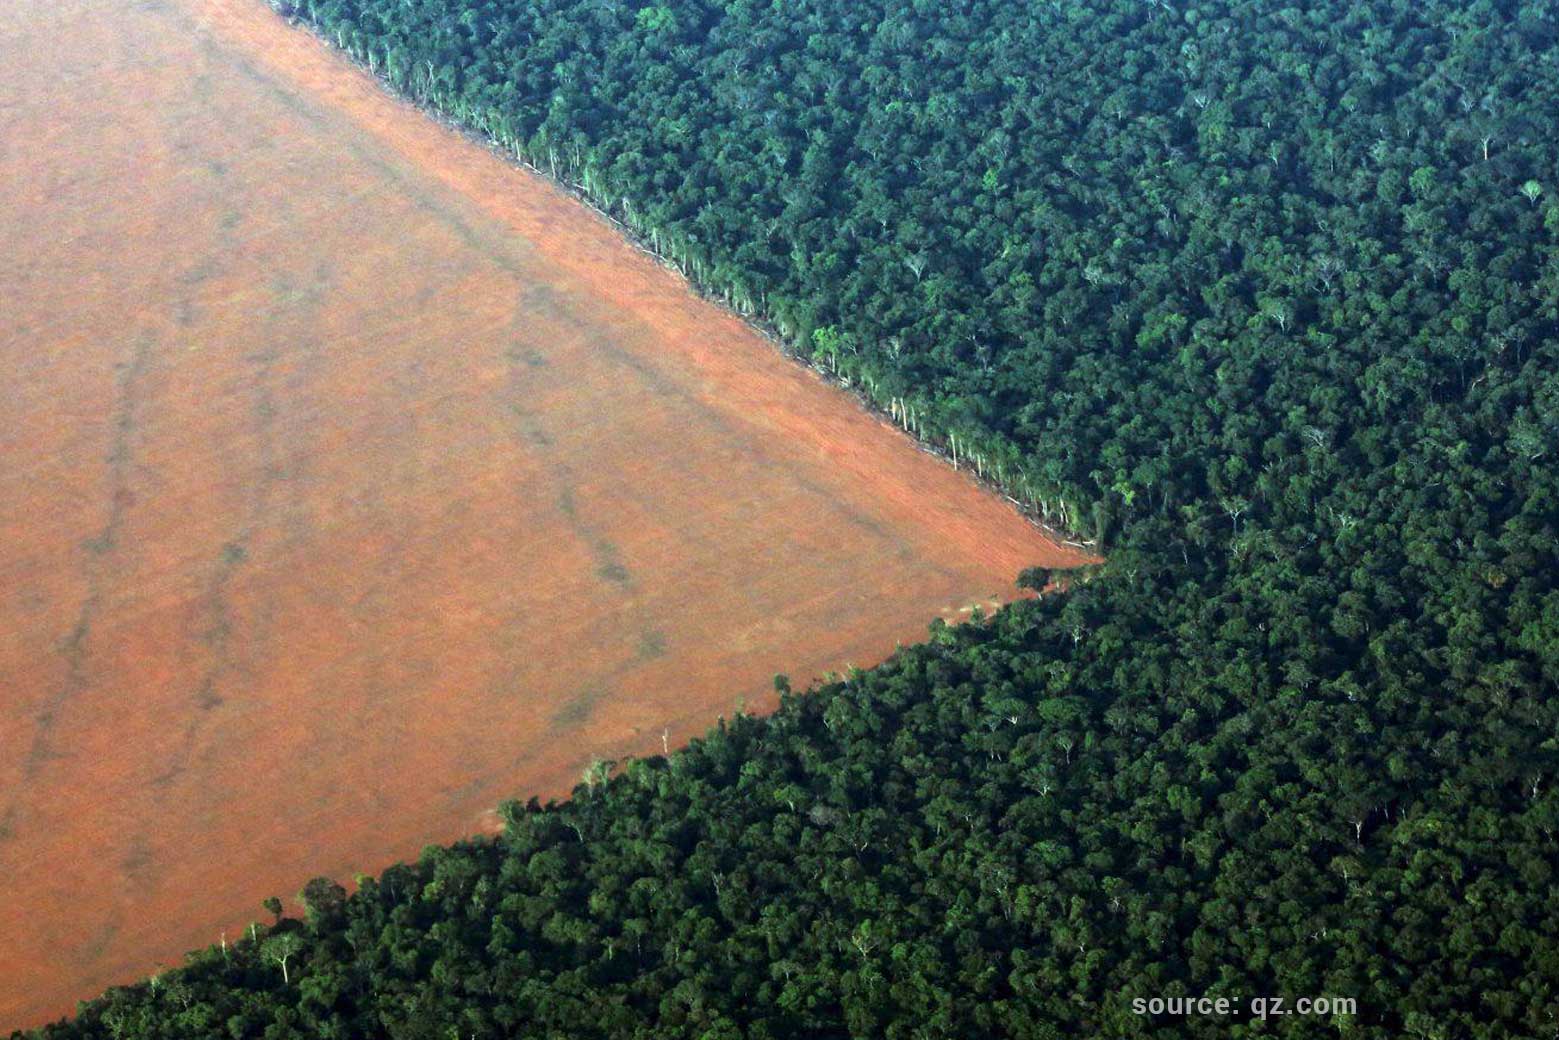
A new study carried out by Graziano Ceddia at the Centre for Development and Environment (CDE), University of Bern shows that greater inequality increases deforestation, and less inequality better protects forests in the long-term.
According to estimates by the U.S. Department of Agriculture, Forest Service roughly 36.21% of the US was forested in 2016. Back in 1630, nearly 46% of land in the US was forested. The gain of farmland is the main reason for deforestation.
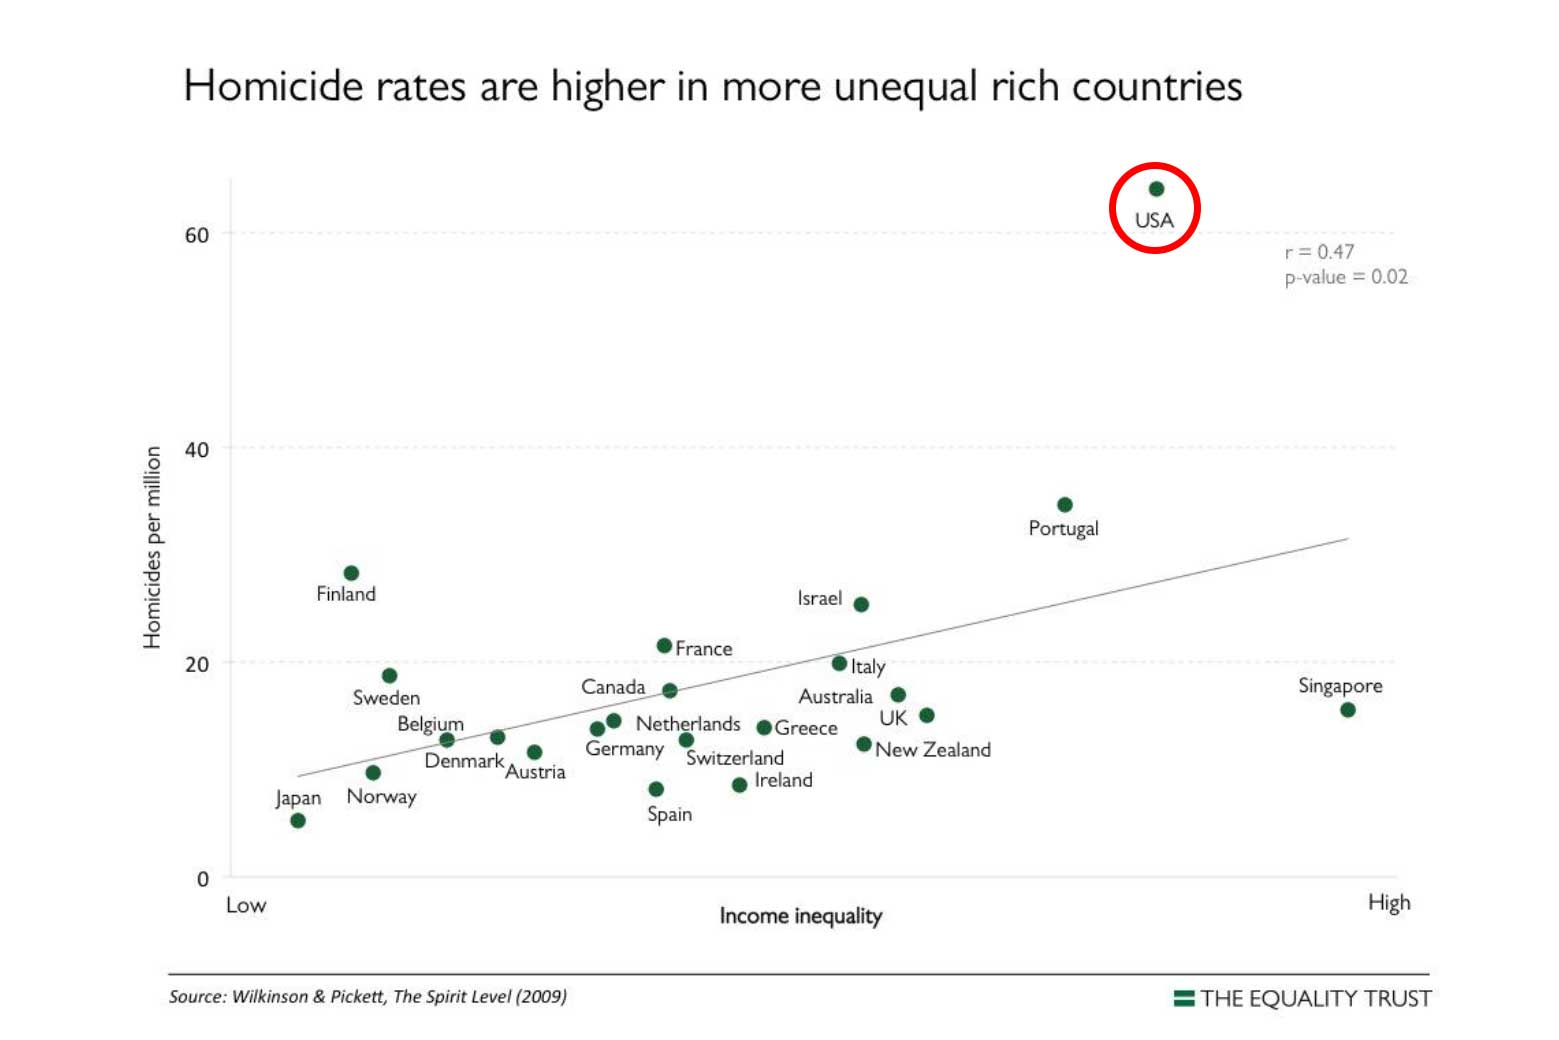
Violence
Violence, as a major health problem in the U.S. and a sensitive indicator of social relations, has been previously studied in relation to income inequality. The evidence indicates that there is a strong relationship between income inequality and the most severe form of violence, namely homicide. As the graph shows, the USA are at the top with a rate of 64 homicides per million.