Portugal
one of the most unequal countries in relation
to income in the developed world
researched
Factors of inequality
History
Income
Taxation system
Social welfare
Housing
Education
Healthcare
Effects of inequality
Housing/Homelessness
Education
Social mobility
Healthcare
Community life and social relationship
Mental health
Drug use
Obesity
Teenage pregnancy
Life expectancy
Violonece
Environment
Waste production
Pollution
Cycling
Deforestation
Sources
BBC
Equality trust
Book: The Spirit Level by Richard Wilkinson and Kate Pickett
Wikipedia
World Bank
OECD (Organisation for Economic Co-operation and Development)
Factors of inequality
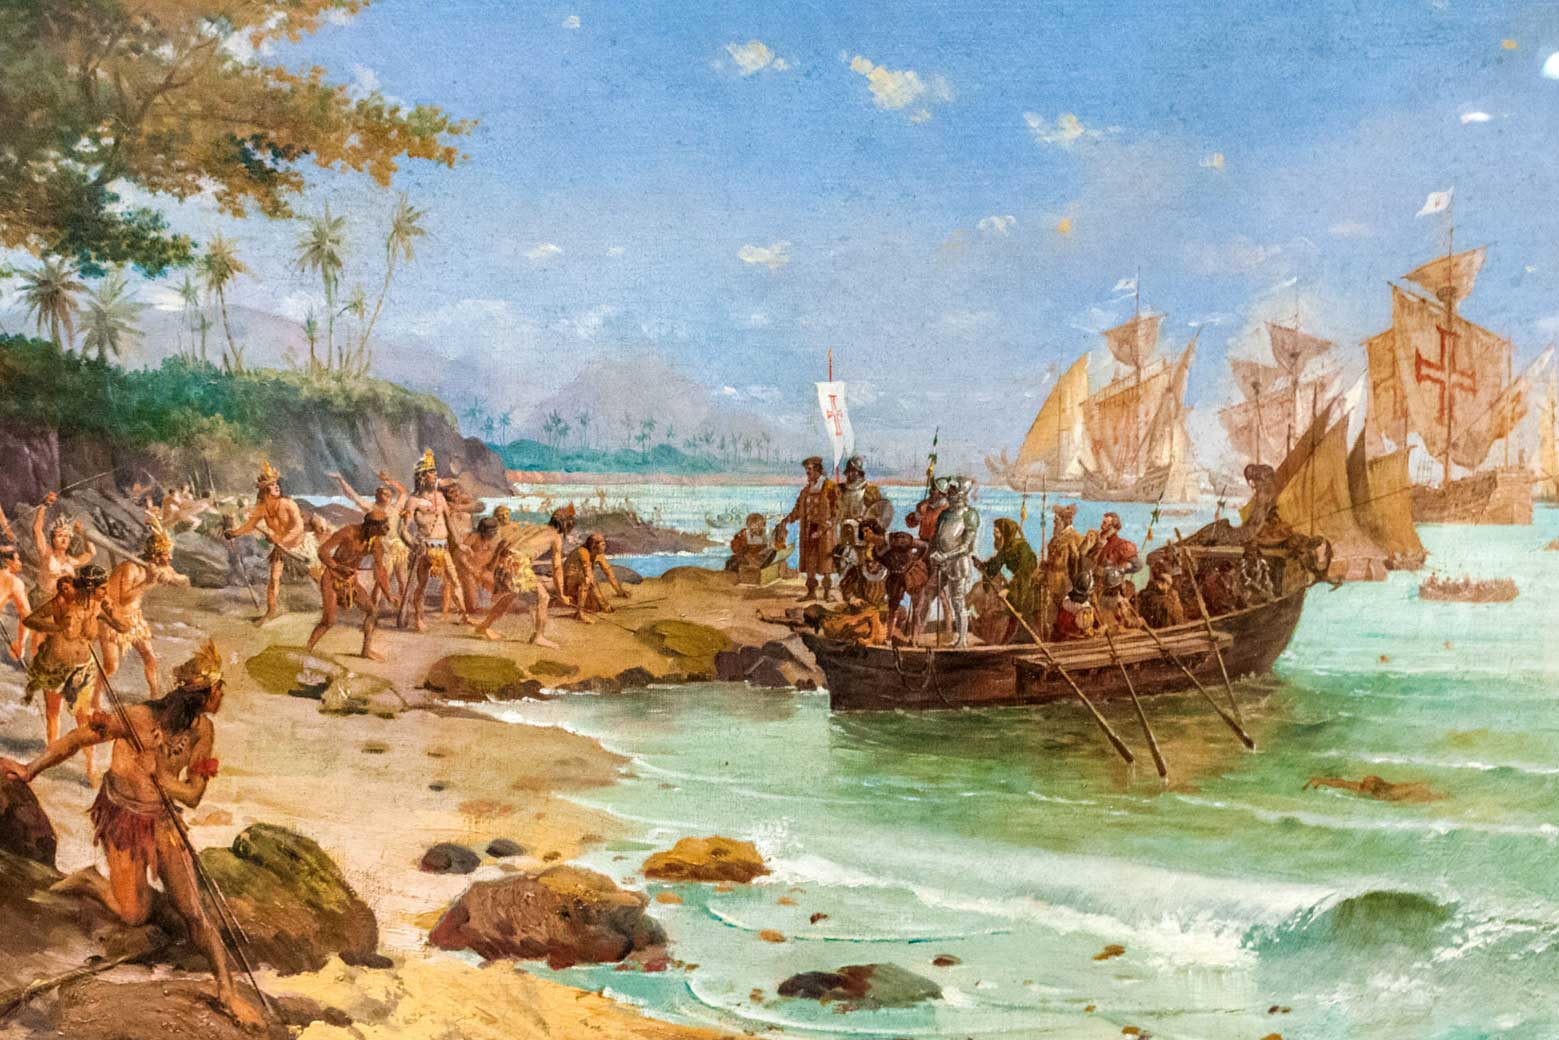
History – a chronology of key events
In 1420 the island of Madeira is discovered and Portugal sends colonists to settle it.
In 1439 settlers are also sent to the islands of the Azores.
In 1446 Portugal claims ownership of Guinea, which becomes the center of their slave trade.
1549 Brazil becomes a royal province of Portugal.
In 1580 Spain annexed Portugal and only in 1640 Portugal becomes independent again.
In 1822 Brazil declared independence from Portugal.
1828 Miguel becomes king of Portugal and rules as an actual monarch.
1836 The shipping of slaves from Angola is banned.
1932-1968 Salazar becomes prime minister and dictator of Portugal, a post he will retain for 36 years.
1974-75 Independence for Portuguese colonies of Guinea-Bissau, Mozambique, Cape Verde Islands, Sao Tome and Principe, and Angola.
1986 Portugal joins the EU
Early 2000s – To address the economic crisis of the early 2000s, the Government of Portugal takes a number of austerity measures that have hit the poorest the most.
In 2011 Portugal had to apply for financial assistance from the EU. Since then Portugal’s economy has registered a gradual recovery.

Income
Since the late 80’s, the Portuguese society is characterized by an increase of income inequalities that reach very high levels at the beginning of the 21st century. The wealthiest 10% of the Portuguese population holds 25.9% of all the wealth, while the poorest 10% have just 2.6%.
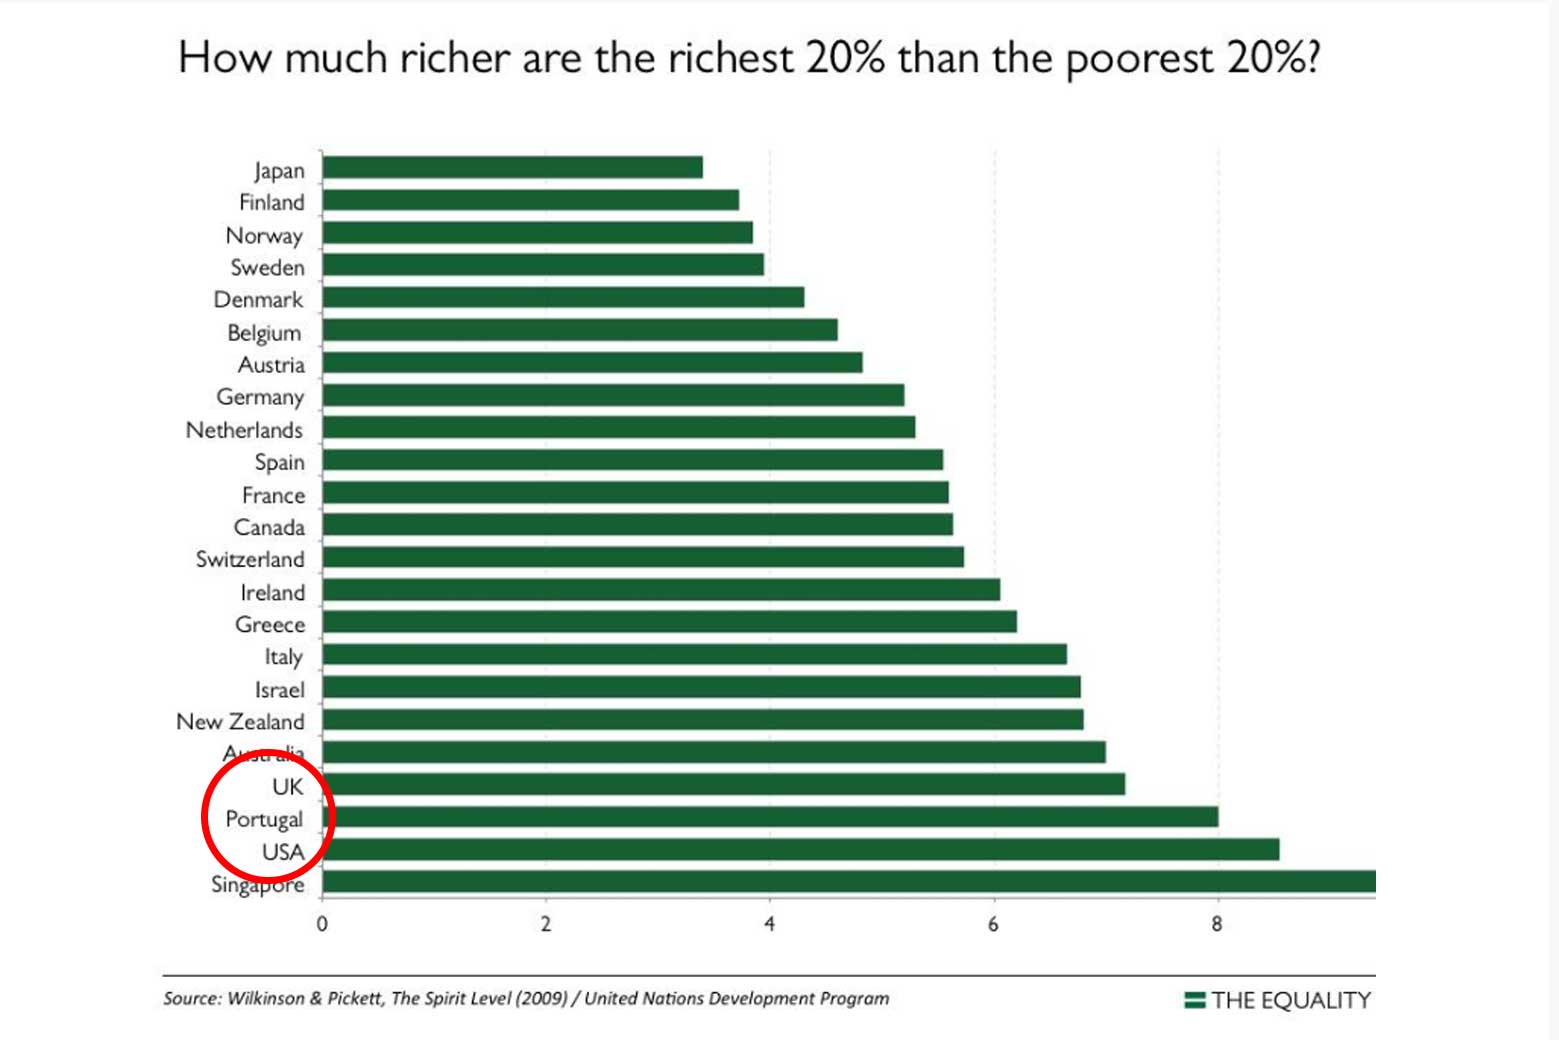
Looking at income inequality and comparing the share of income received by the highest-income people, the following graph shows how the size of income differences varies from one developed country to another.
The length of the horizontal bar shows how much richer the richest 20 percent of the population is in each country compared to the poorest 20 percent. Portugal is at the bottom of the chart where the richest 20 percent get about 8 times as much as the poorest.
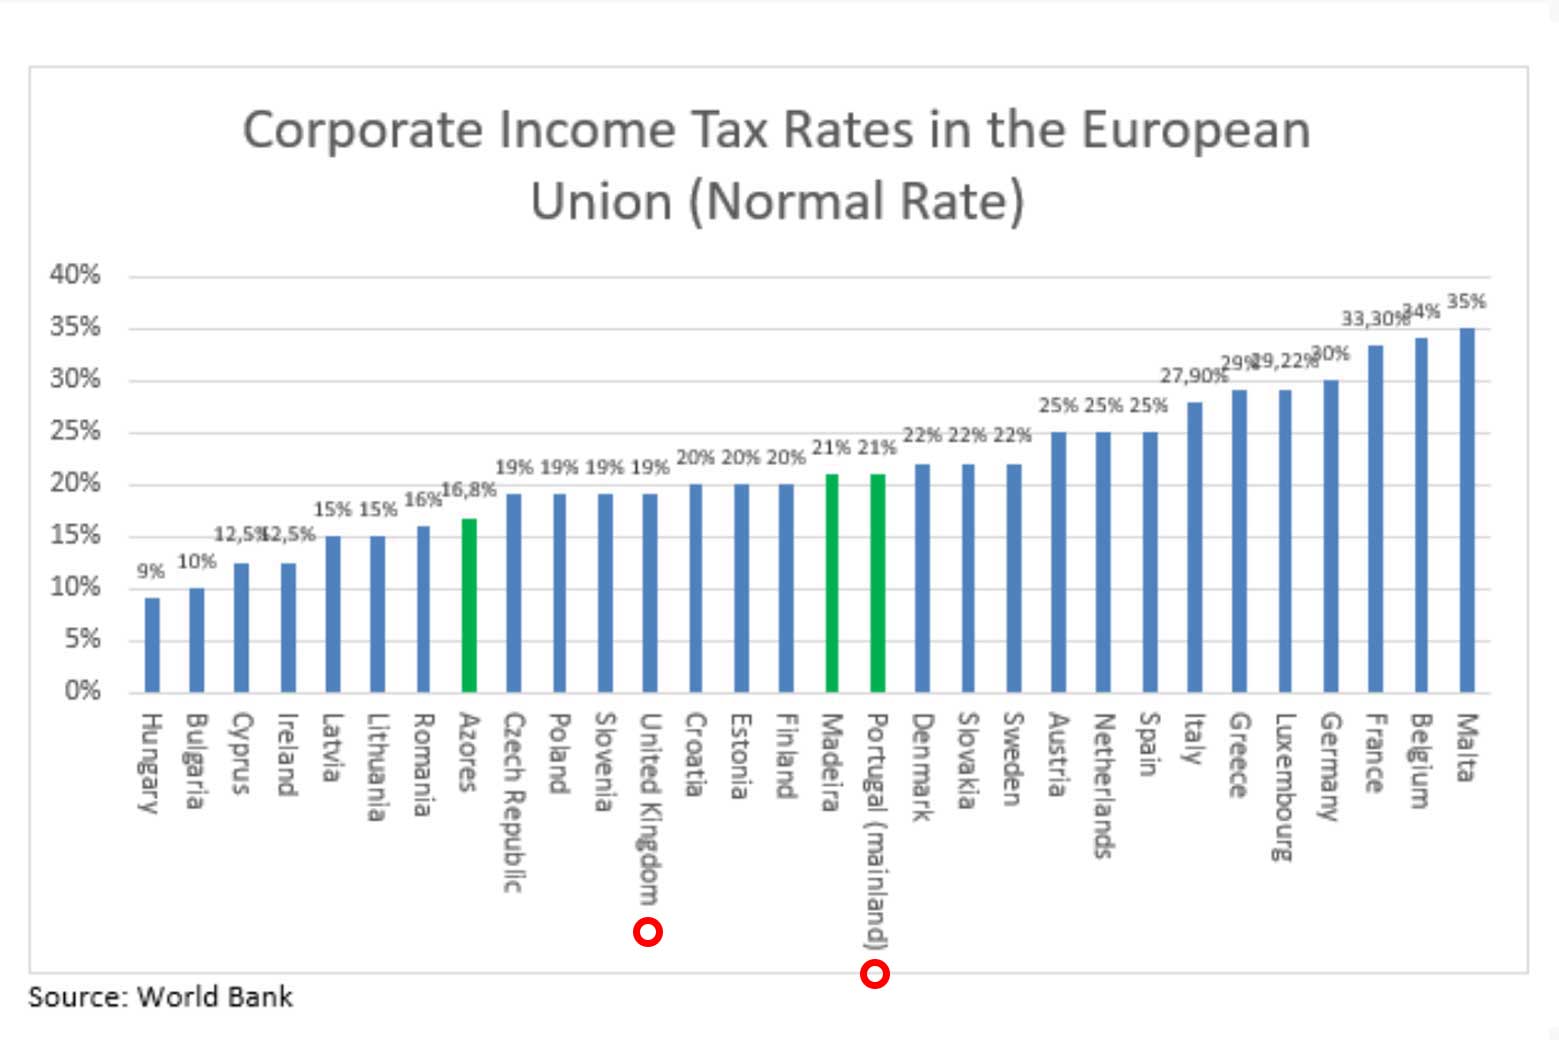
Tax system
Taxes in Portugal are levied by both the national and regional governments. The most important revenue sources include income tax, social security contributions, corporate tax and the value added tax, which are all applied at the national level. The standard corporate tax rate lays by 21% for Mainland Portugal and Madeira and 16.8% in the Azores.
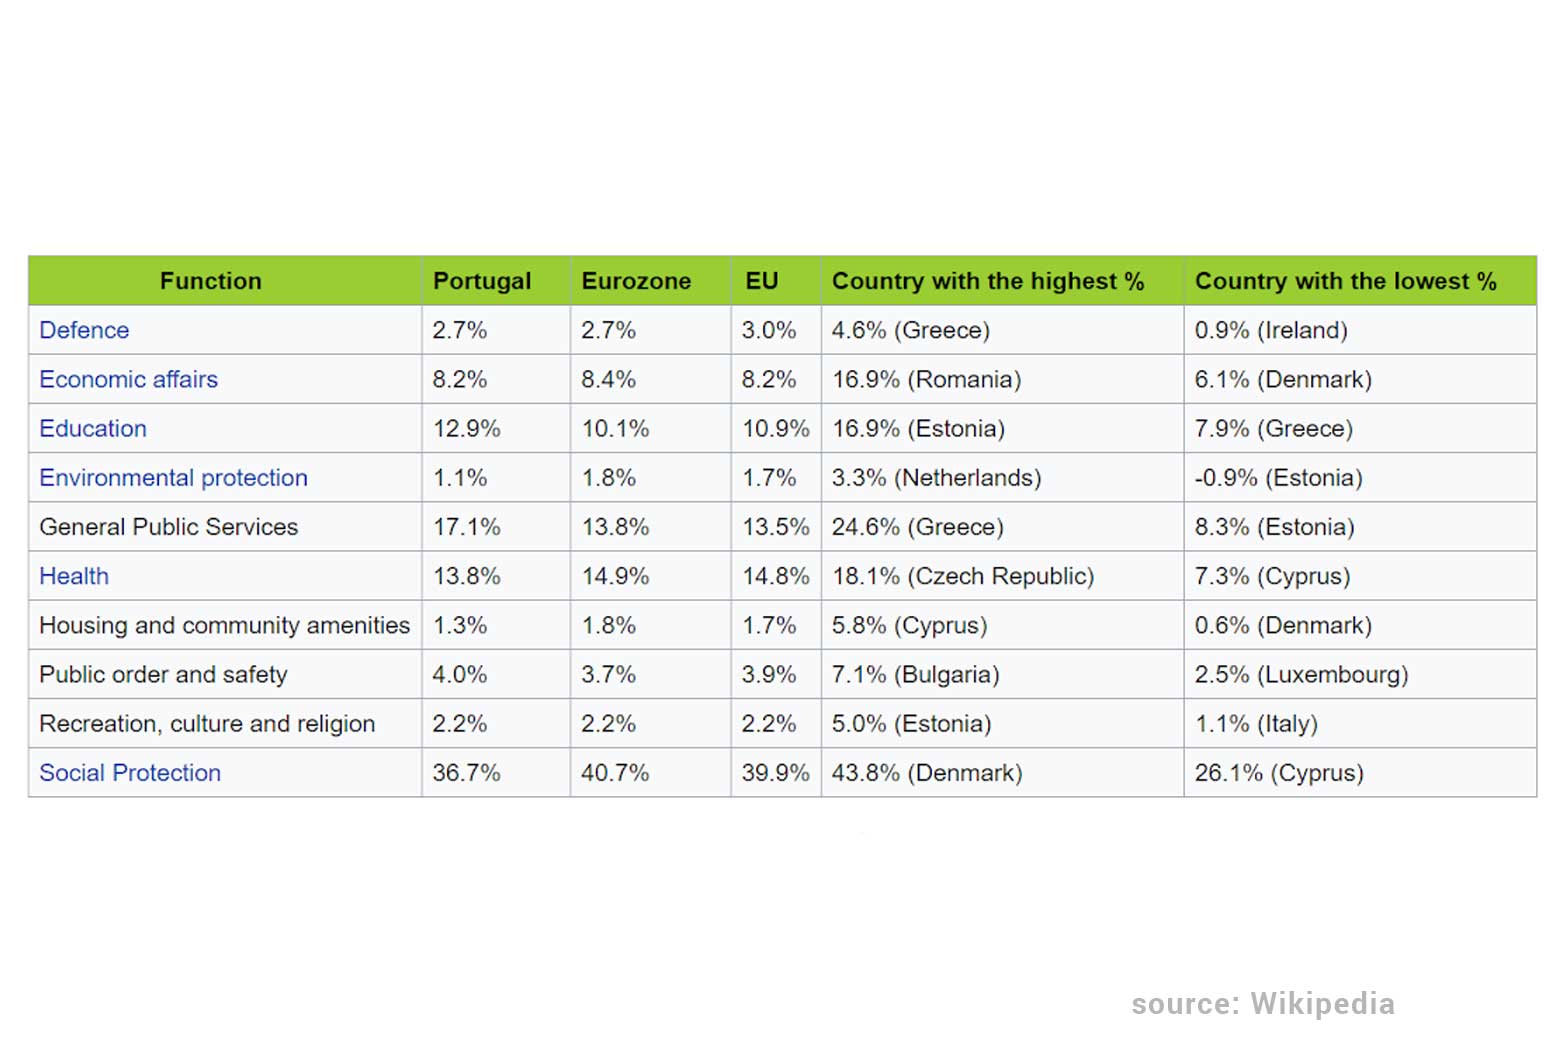
Social welfare system
Interestingly, the government spends most of its revenue on social protection as this chart shows. Social protection consists of policies and programs designed to reduce poverty and vulnerability.
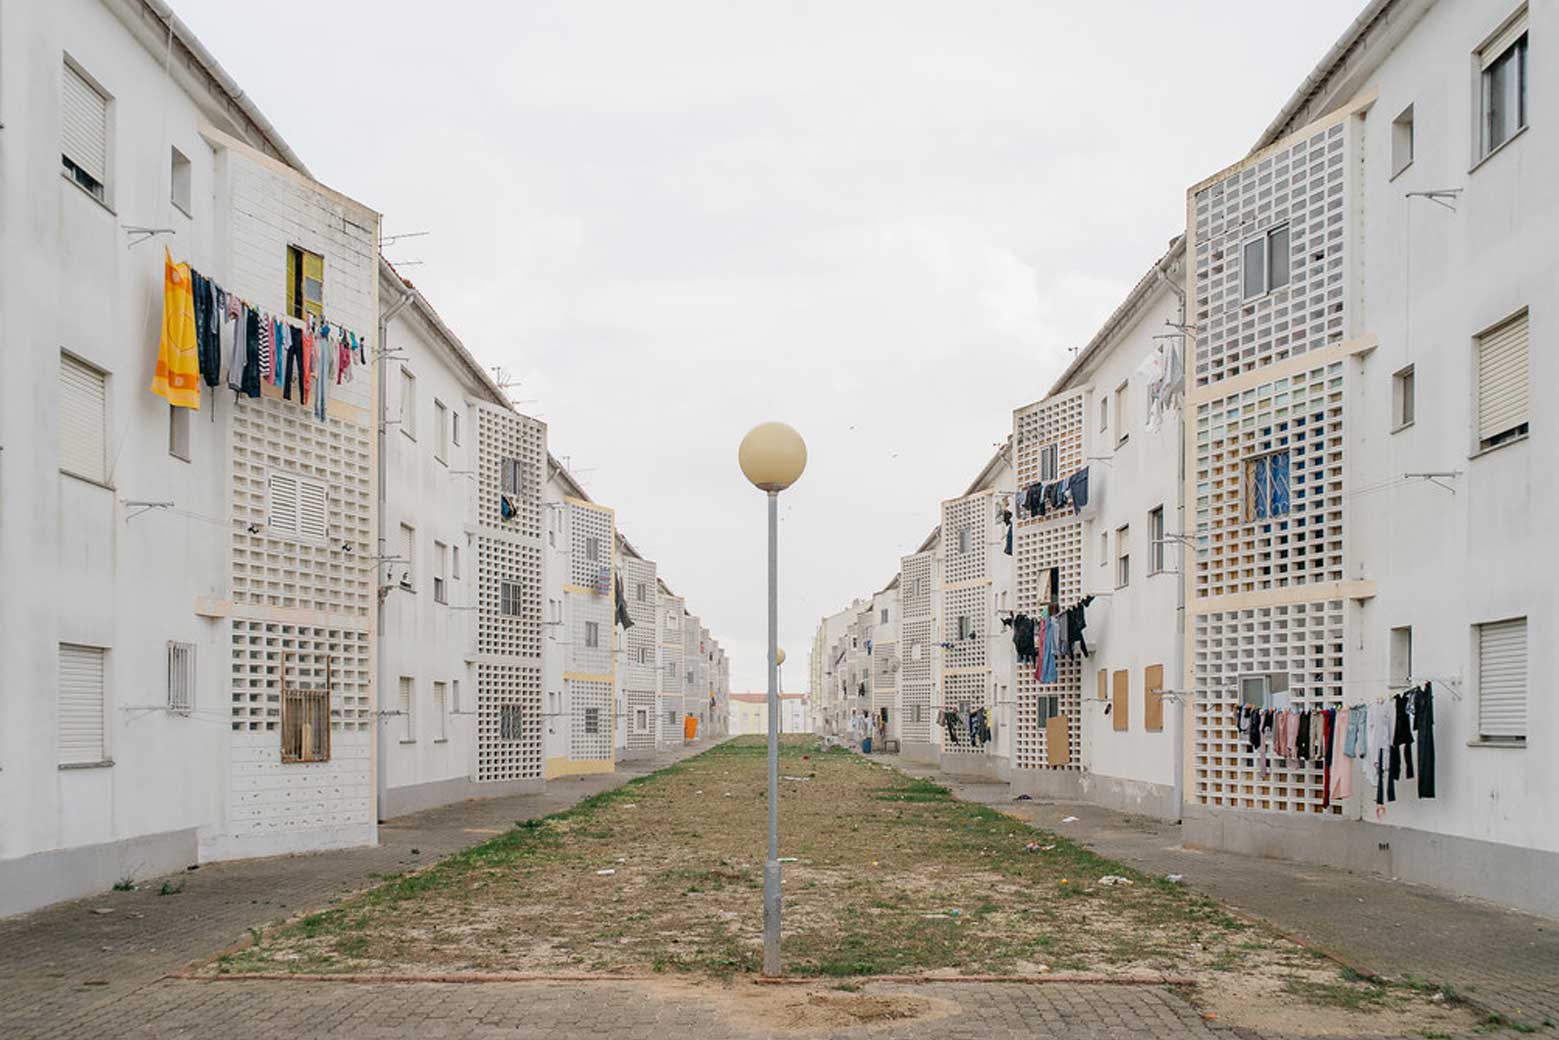
Access to housing
In all of Portugal there are only 120,000 social housing units, a figure that seems rather low in the light of the national poverty rate. Waiting lists for social housing are long; for example approximately 4,000 households applied for a unit in 2016.
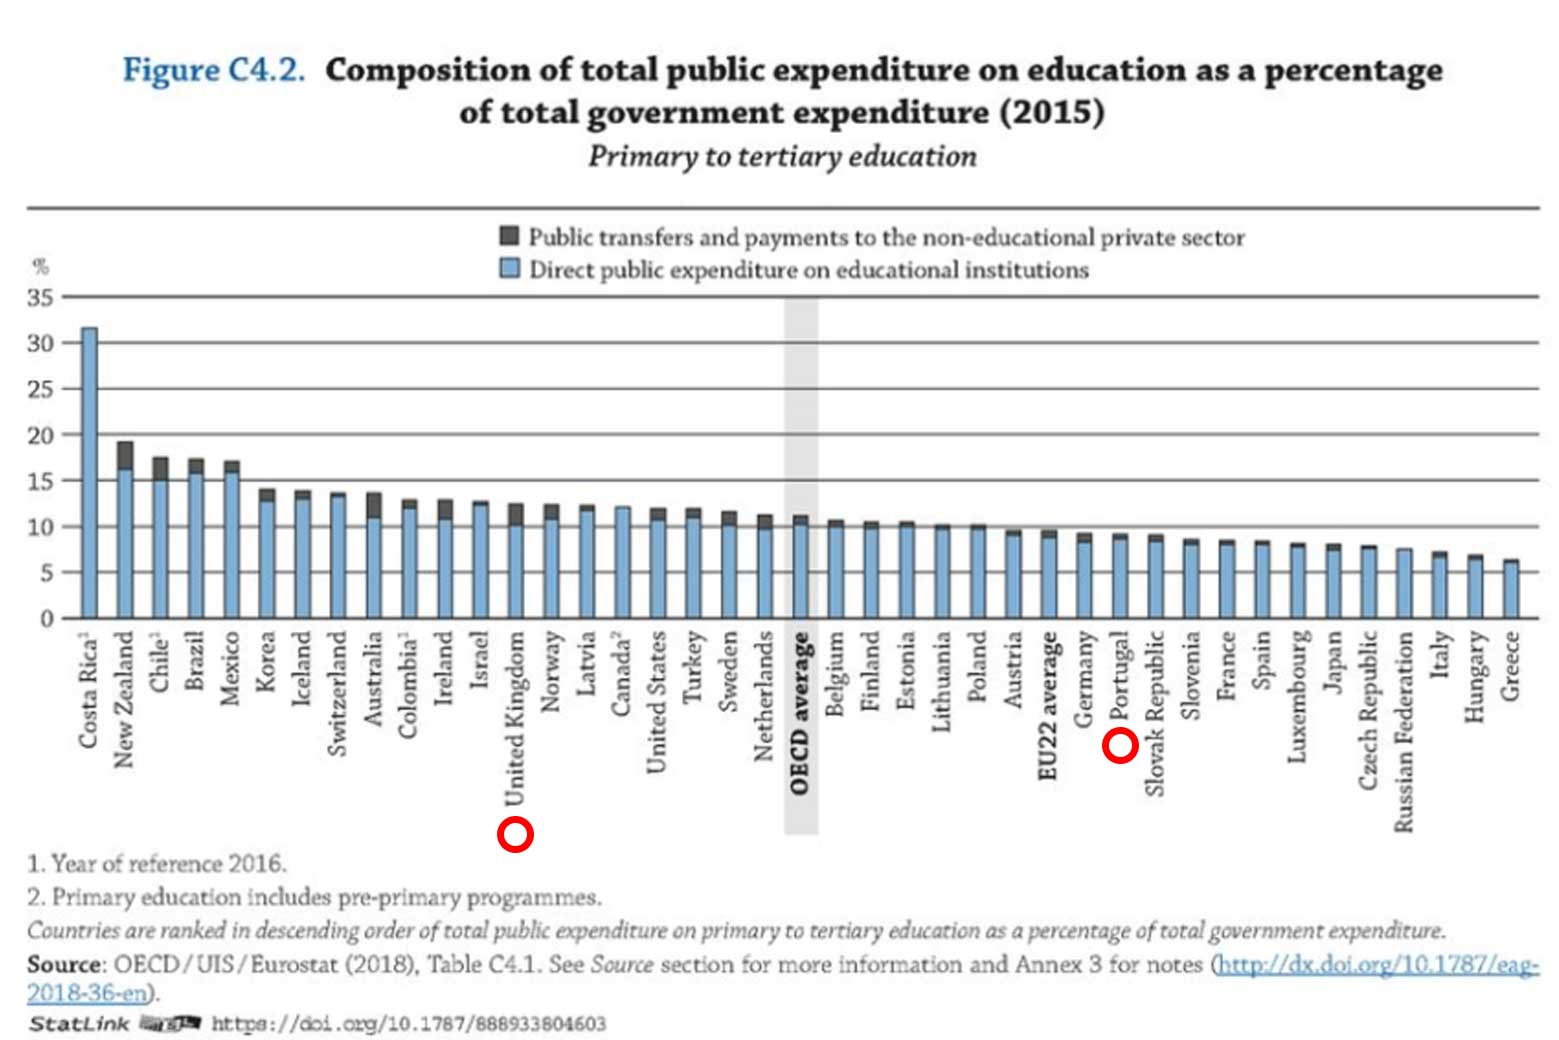
Acess to education
Portugal is indeed one of the OECD (Organisation for Economic Co-operation and Development) countries with the lowest educational level. The annual expenditure on Portuguese educational institutions per student is below the EU average.
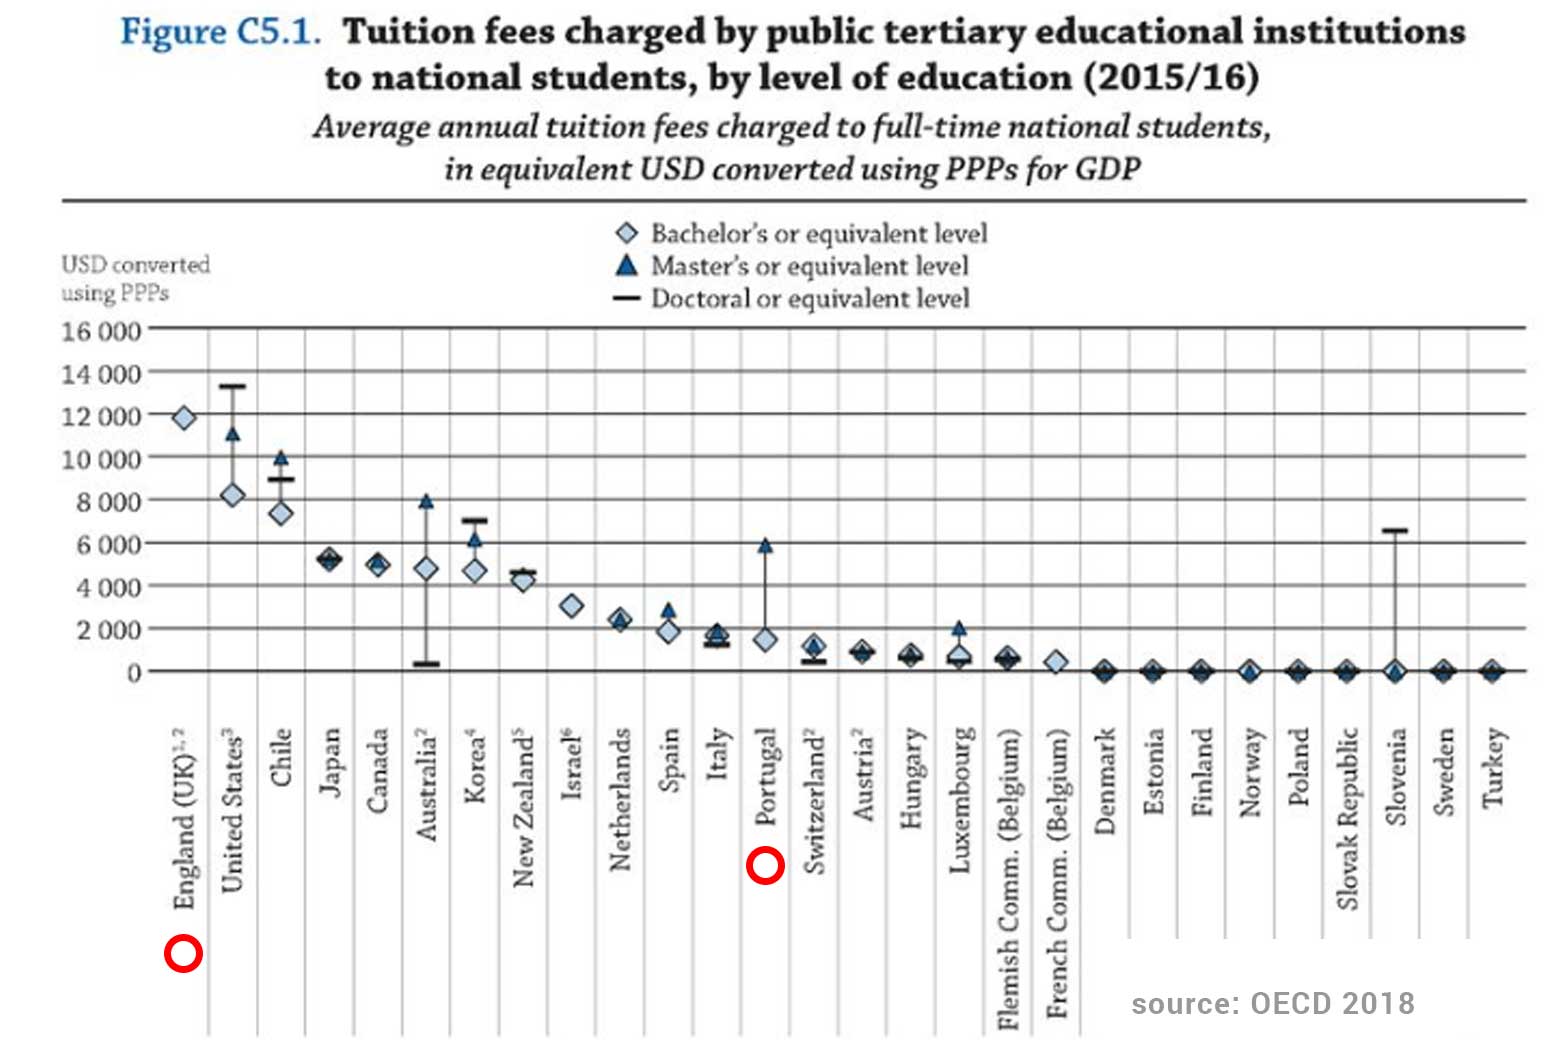
Access to higher education
Full time students enrolled in bachelor’s and master’s programs are charged an average tuition fee of approximately 950 – 1250 EUR per academic year which again is a factor inhibiting access to higher education to people from disadvantaged backgrounds.
Access to healthcare
Just briefly about the Portugal’s health care system. It consists of a National Health Service, a social security scheme, and voluntary private health insurance.
Spending on health has declined in response to the economic crisis. In 2015, Portugal spent EUR 1 989 per capita on health care (adjusted for differences in purchasing power), about 30% below the EU average of EUR 2 797.
A barrier to healthcare are co-payments (a co-pay is a fixed out-of-pocket amount paid by an insured for covered services) so co-payments for a wide range of services, such as primary care visits, emergency visits, etc. which are significantly higher than the EU average. Nevertheless, there are exemptions based on income for certain population groups and certain medical conditions. Currently, the biggest barriers to accessing healthcare in Portugal are waiting times and the uneven geographical distribution of facilities.
Effects of inequality
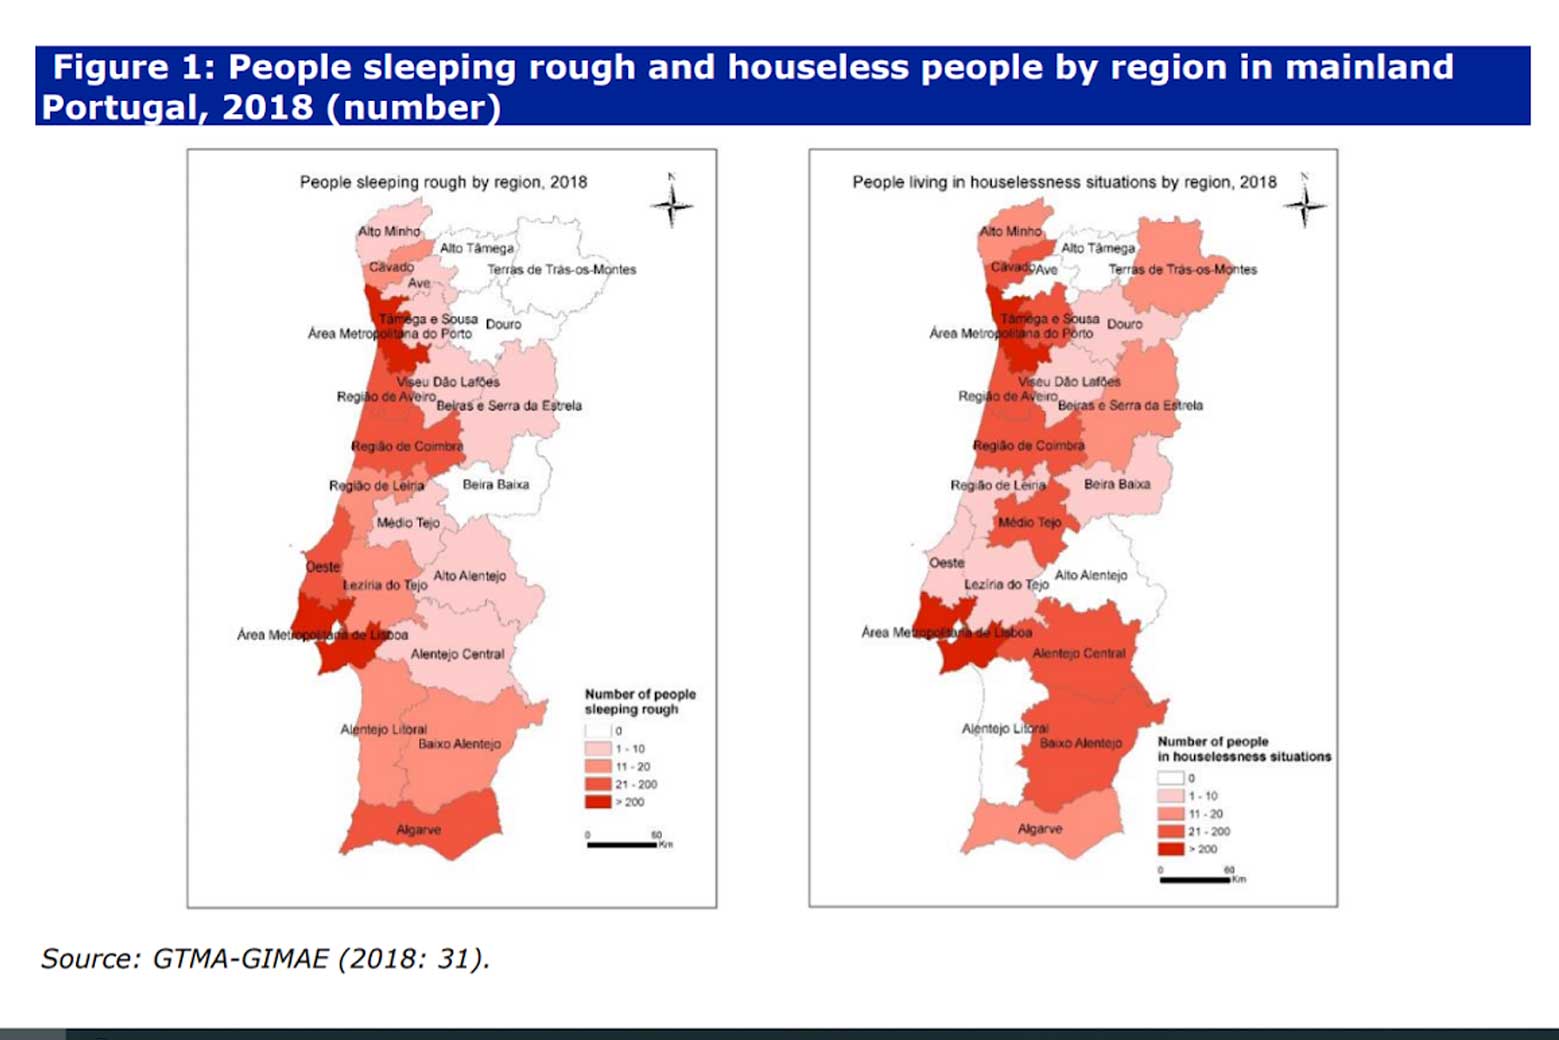
Homelessness
There is no official data collection strategy for homelessness in Portugal. According to the latest survey on this subject, in the first half of 2018 a total of 3,396 people were either roofless or in some form of houseless situation, including 1,443 people sleeping rough.
Only recently Portugal has enacted a new housing law that emphasises that the State has to guarantee housing as a human right. In a crucial provision, the Basic Housing Law prohibits any eviction of vulnerable people unless the State is able to provide suitable alternative accommodation. The future will show how the government will implement these regulations into practise.
Education
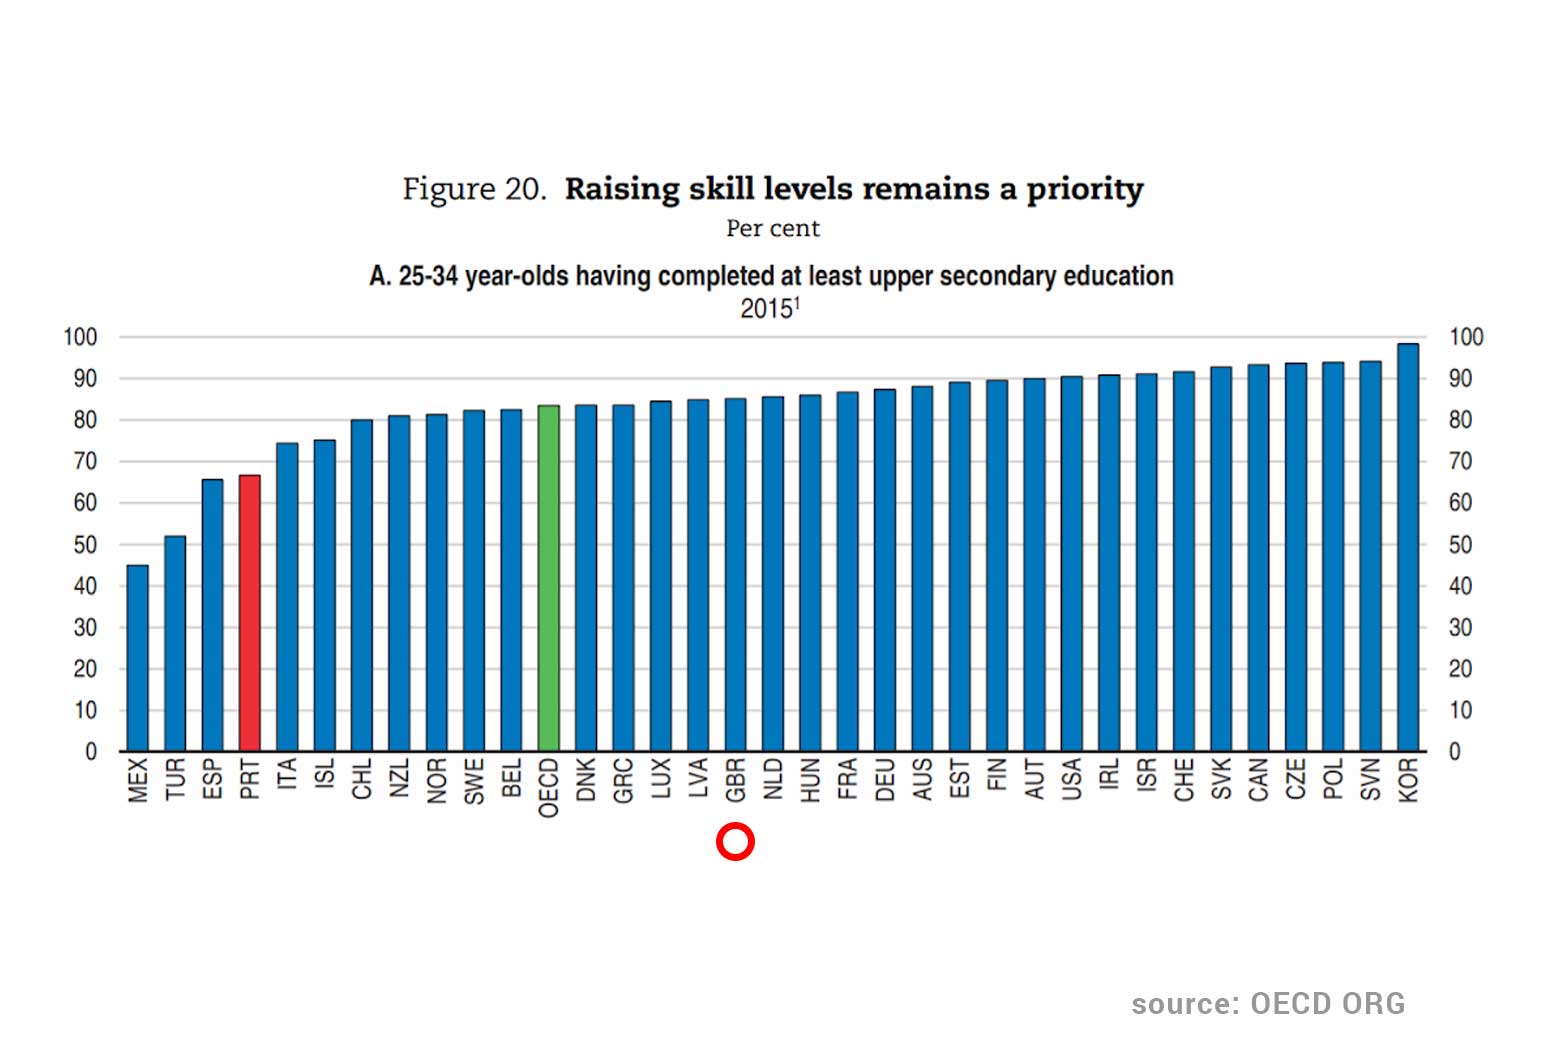
In comparison to other European countries, the average skills of Portuguese citizens are low, reflecting decades of poor education performance. Only around 43% of the working age population and 67% of young adults have attained upper secondary education, the fourth lowest rate in the OECD (organisation for economic co-operation).
33% of young adults in Portugal have a tertiary/higher qualification, compared to an OECD average of 42%. Better skills would reduce widening income inequality by providing better earnings opportunities for the low-skilled, which often also have low incomes.
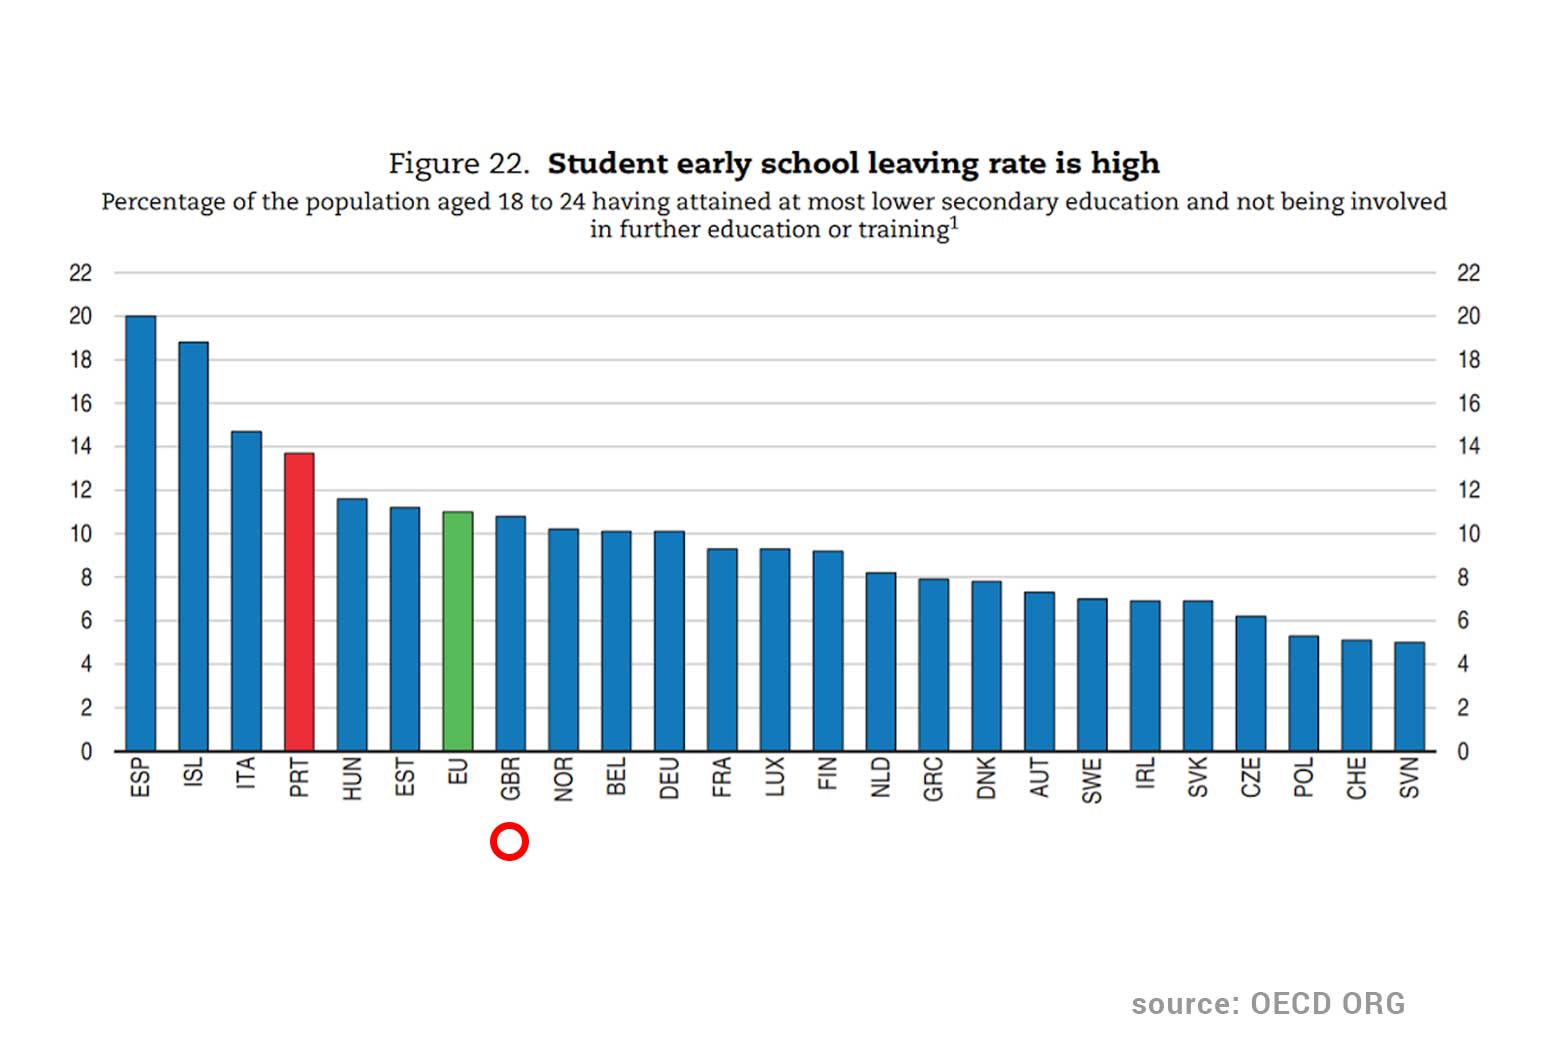
Drop out rate
Portugal’s early school leaving rate among youths aged 18-24 has come down substantially from 63% in 1991 to 14% in 2015, but it is still high in comparison to other European countries as you can see on the graph.
Social mobility
Generally speaking, children whose parents have less education perform worse than others on average and children with better educated parents do better. In mathematics for example, Portuguese children of age 15 with less educated parents scored 453 on average in PISA (Programme for International Student Assessment) tests while those with highly educated parents scored 540.
Healthcare
As in most EU countries, unmet care needs are reported more often by poor people. In Portugal, 5.4% of people from low-income households reported going without a medical examination when needed for financial reasons in 2015 which is significantly higher than the rate for the highest income group (0.4%).
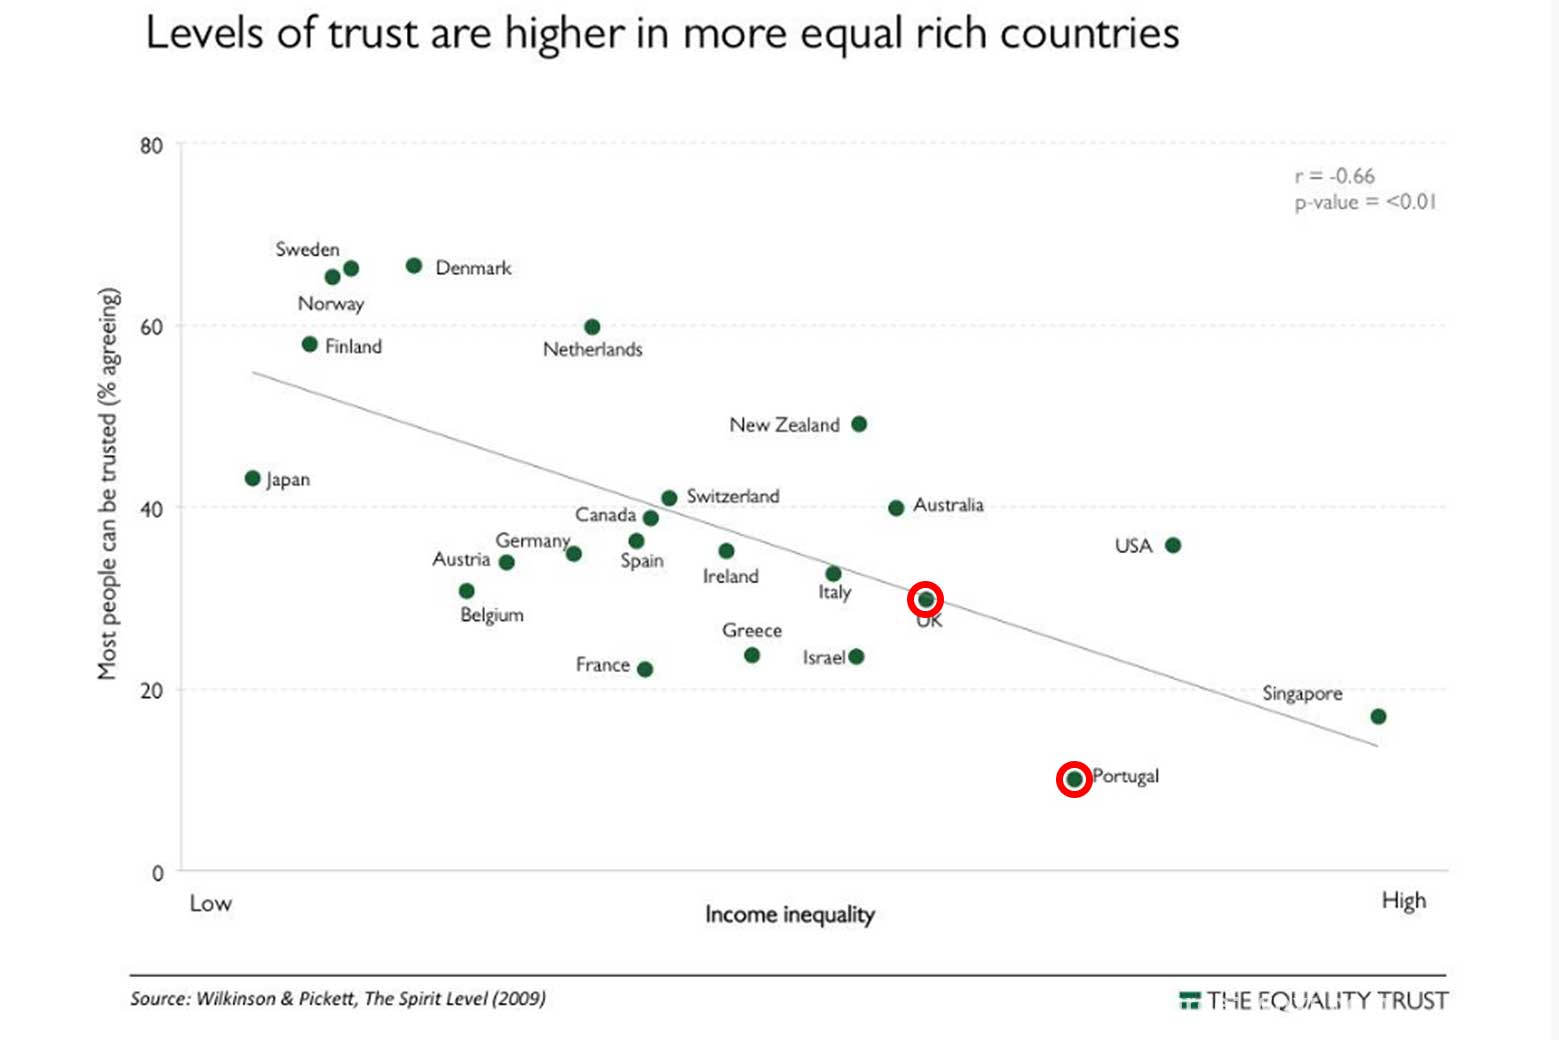
Community life and social relationships
The effect inequality has on trust is large in Portugal that has the lowest level of trust where only 10% of the population believe that other people
Mental health
Portugal is the fifth OECD country with the greatest prevalence of mental health issues. Almost 1 in 5 Portuguese suffer mental health problems. The “most common issues are anxiety and depression”. Portugal annually spends around 6.6 billion euros treating mental health disorders, which translates into around 3.7% of GDP.
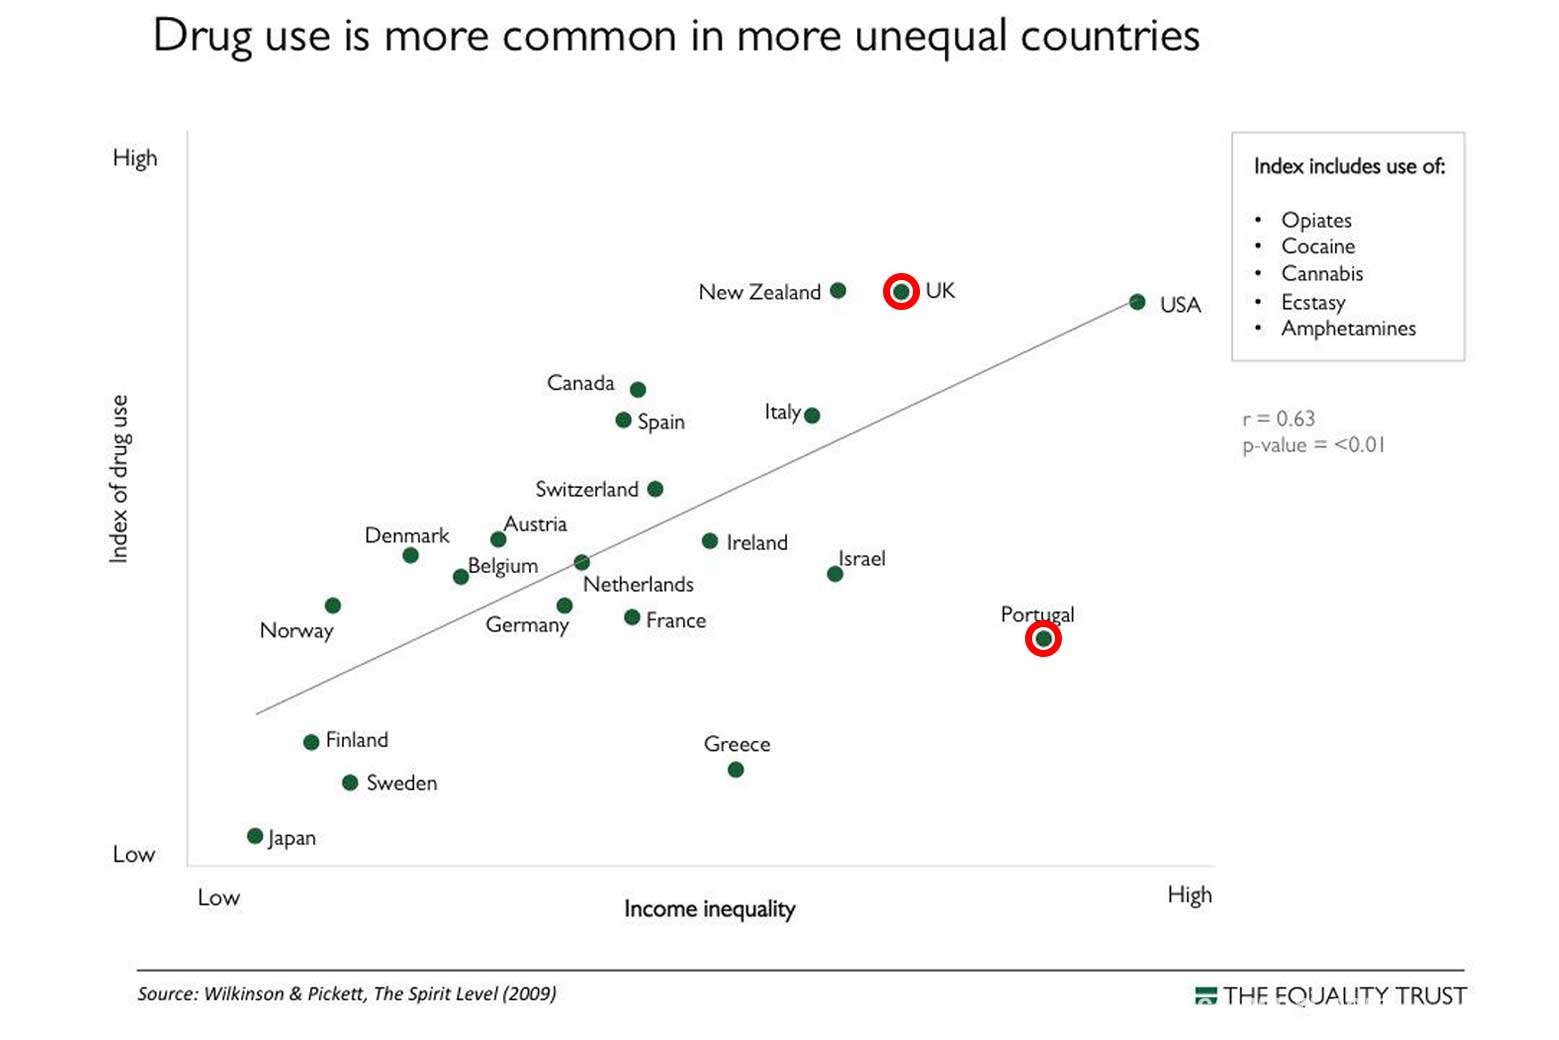
Drug use
There is a strong tendency that also drug use is closely related to income inequality. Portugal’s drug situation is characterised by a level of drug use in the general population that is, on the whole, below the European average. This can be explained by the government’s policies to decriminalise the use of drugs.
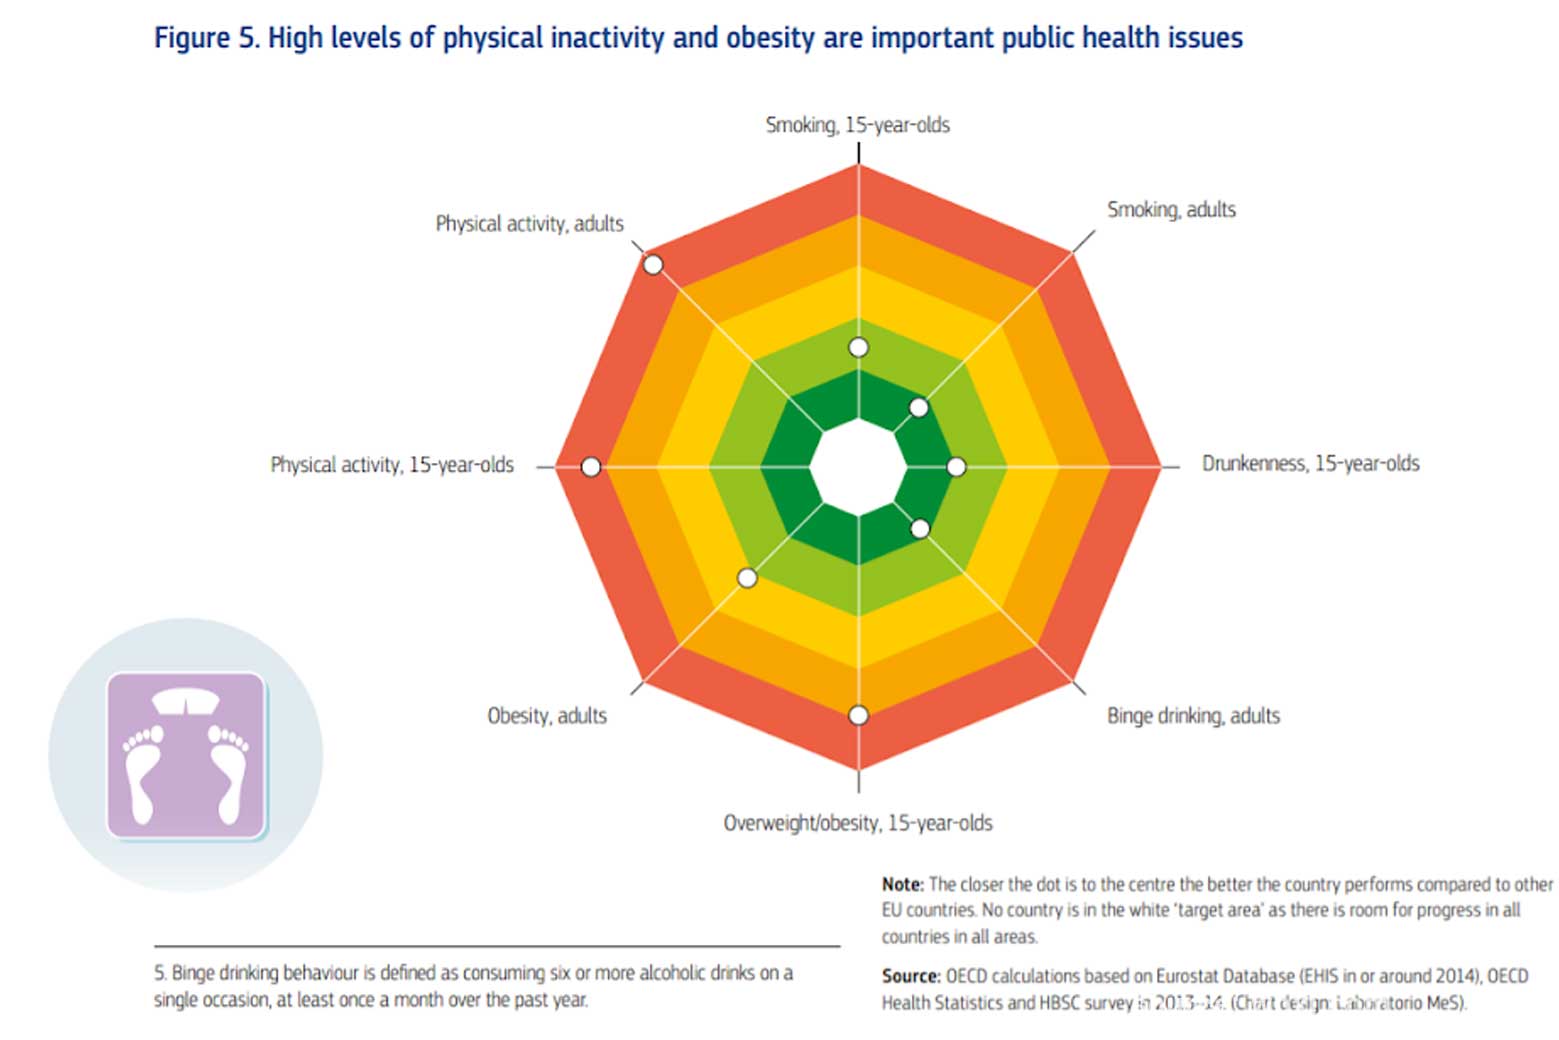
Obesity
Based on 2014 self-reported data (which tend to underestimate the true prevalence of obesity), about one in six adults in Portugal is now obese, which is nearly one percentage point above the EU average.
The obesity level among those with the lowest level of education is more than twice as high as the level among the highest educated. While the prevalence of overweight and obesity among 15-year-olds remains close to the EU average, it grew by almost 60% between 2001–02 and 2013–14.
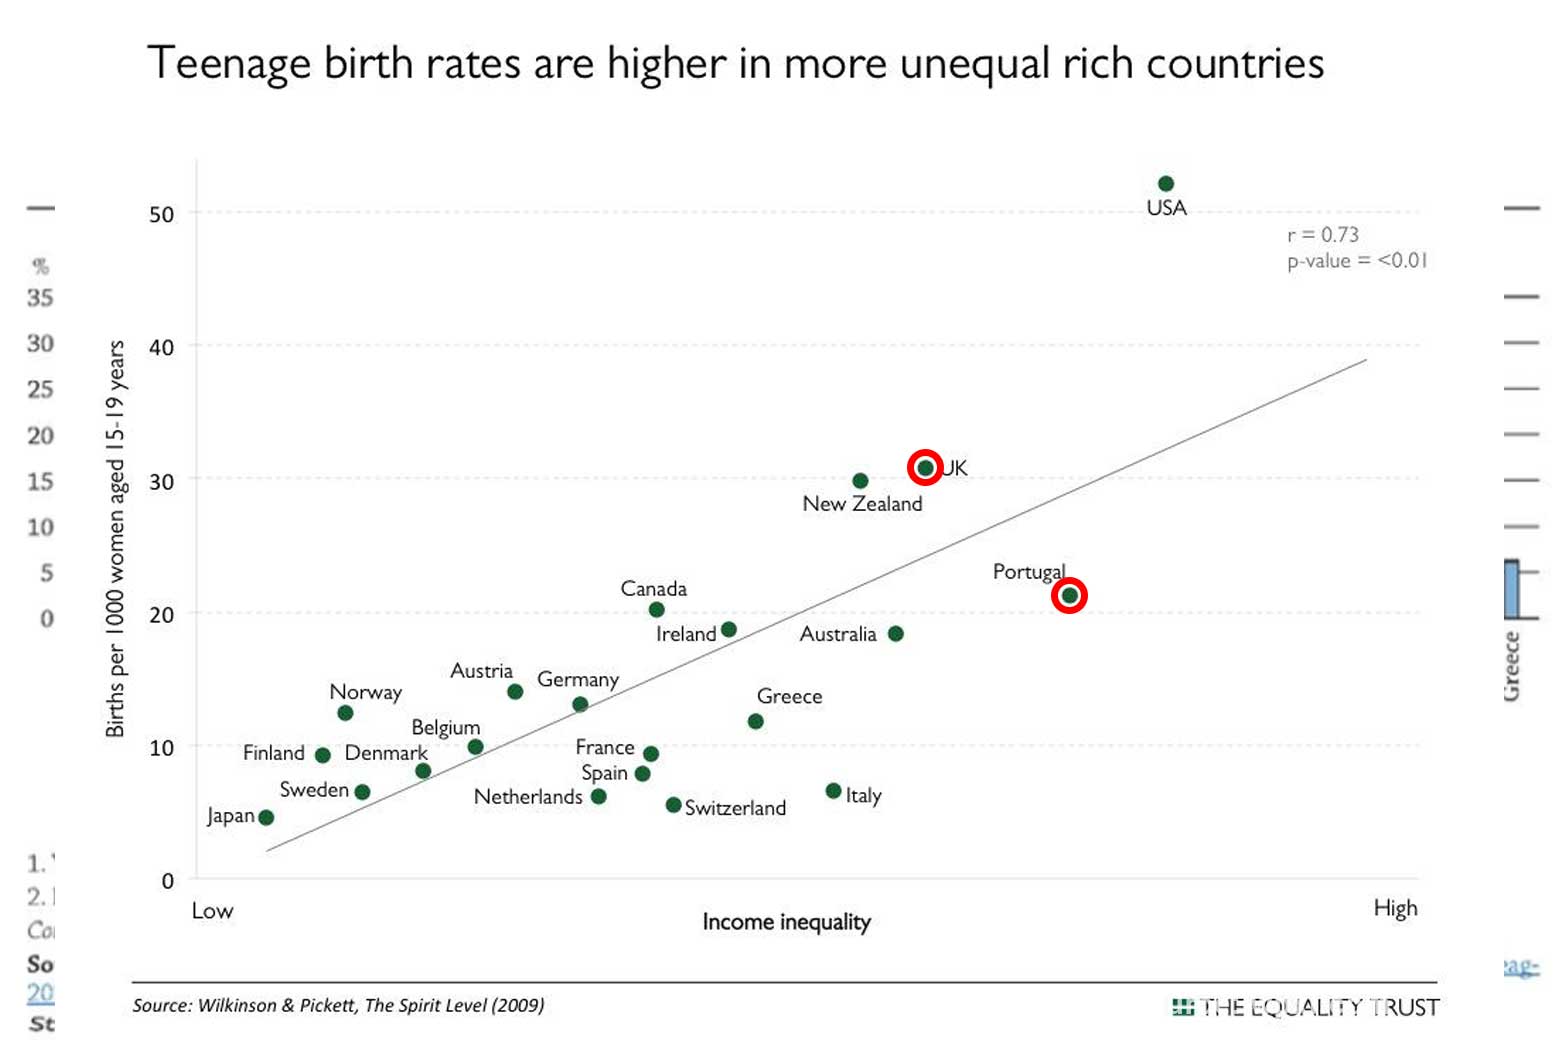
Teenage pregnancy
Portugal is among the countries that also top the charts when it comes to teenage birth where the teenage birth rate lays by over 20% (per 1000 women aged 15-19). The graph shows that it is linked to income inequality.
Life expectancy
At birth in Portugal increased by over four years between 2000 and 2015, to 81.3 years. A sizeable and persistent gap exists however between socioeconomic groups and by education, especially for men: Portuguese men with a university education live five years longer than those with lower education, compared to a three-year gap for women.
However, even if life expectancy is on the rise, the Portuguese are more pessimistic when assessing their health. There is a large gap in self-rated health by socioeconomic status, with 59.4% of those in the highest income quintile reporting very good or good health, compared with only 37.4% in the lowest.
Portugal also has the highest share of people reporting low life satisfaction (24%) in the OECD.
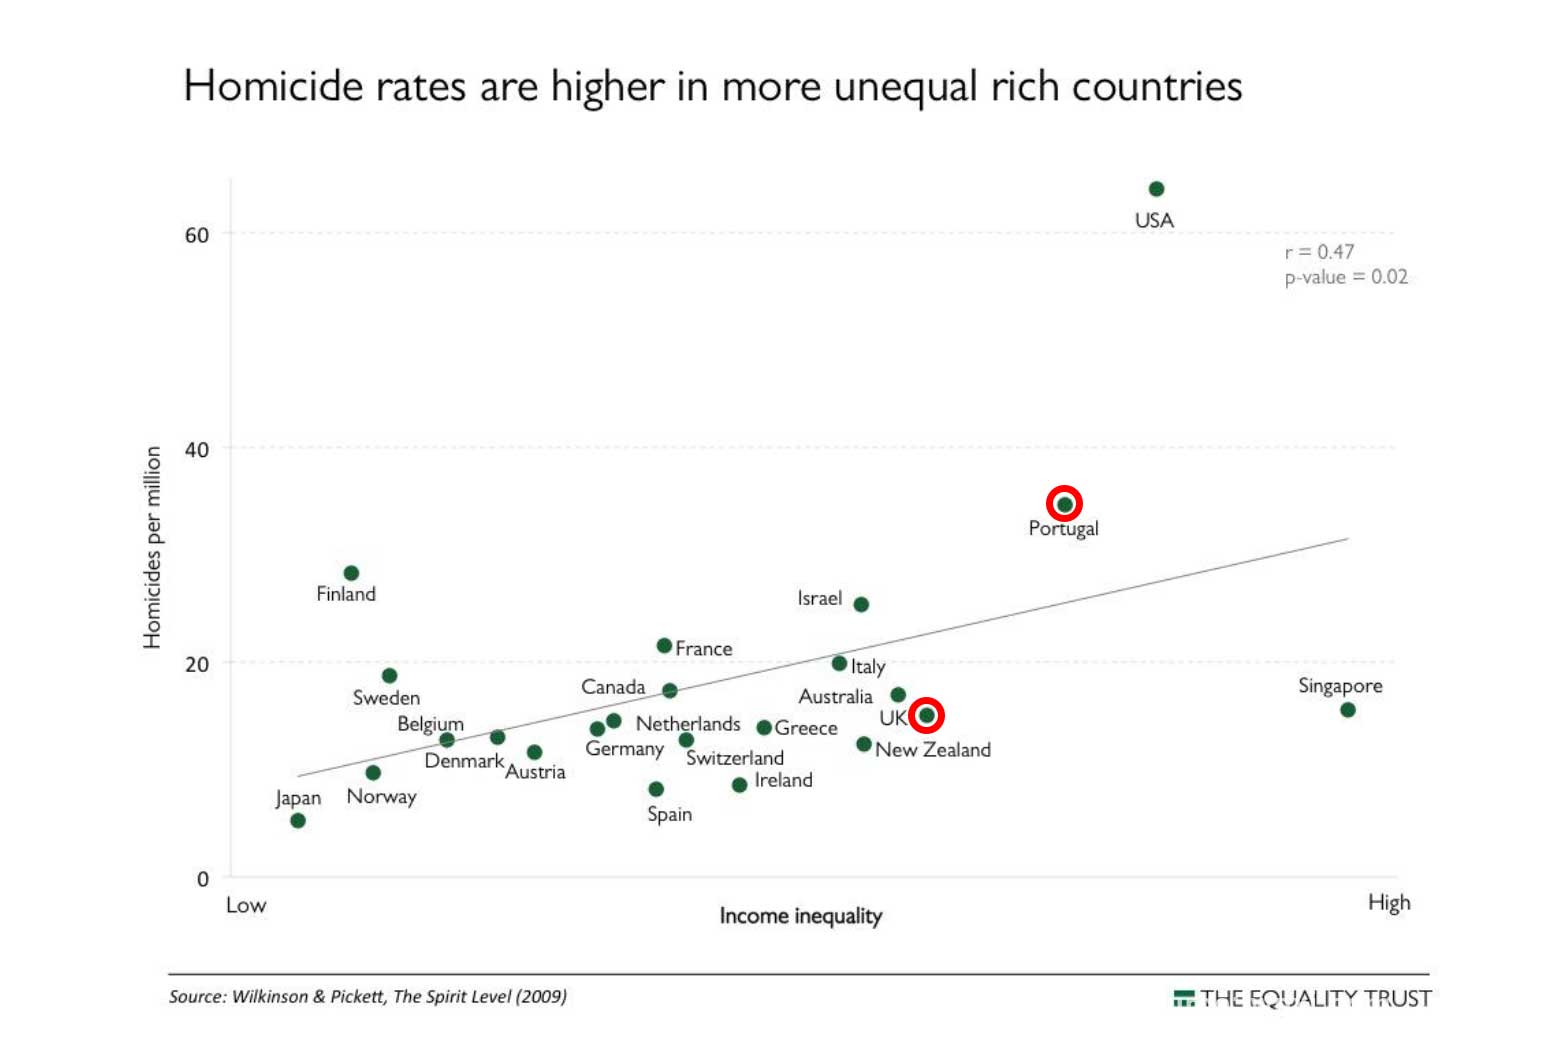
Violence
Violence, as a major health problem in Portugal and a sensitive indicator of social relations, has been previously studied in relation to income inequality.
The evidence indicates that there is a strong relationship between income inequality and the most severe form of violence, namely homicide. As the graph shows, Portugal follows the USA with a rate of over 30 homicides per million.
Environment
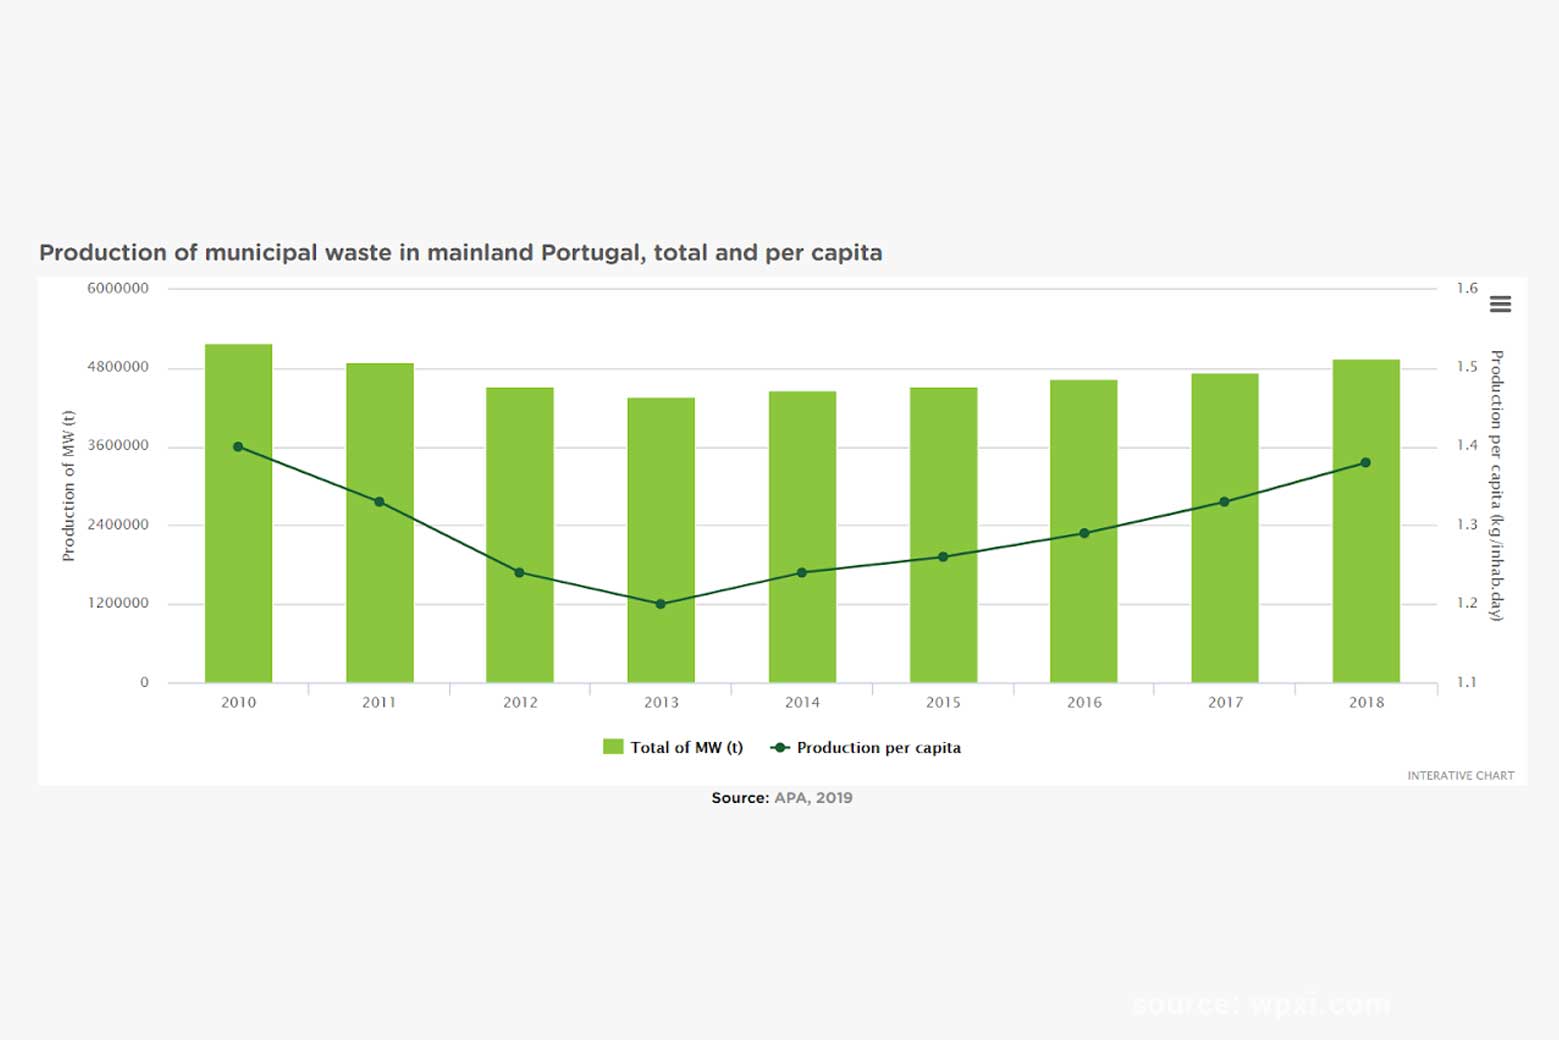
Waste production
Portugal generated significantly less household waste than the OECD average. The decline following the sharp recession seems to have halted though. Landfill remains the most common form of disposal. The total production of municipal waste in mainland Portugal, in 2018 corresponded to 505kg/ inhabitant and year. These values confirm the increasing trend in waste generation observed since 2014.
This increase may be related to an improvement of the economic situation in Portugal, which seems to indicate that the objective of dissociating waste production from economic growth is not being achieved.
Pollution
Portugal’s emissions of greenhouse gases (GHG) per unit of GDP are well below the OECD average. The carbon intensity of the economy has been declining since 2000 as the contribution of renewables has been rising.
Cycling
Portugal is the 26th-placed country in ranking of 192 countries based on number of vehicle registrations with 492 motor vehicles per 1000 people.
Cyclists are still underrepresented on the roads of Portugal with only 2,6% of the people. In the 2011 national census, bicycle mode share as an option for commuting had dropped to a negligible 0,5%.
However, the Portuguese government plans to invest 300 million euro by 2030 in the construction of new bike lanes, linking already existing ones, in order to encourage the use of bicycles at the expense of cars.

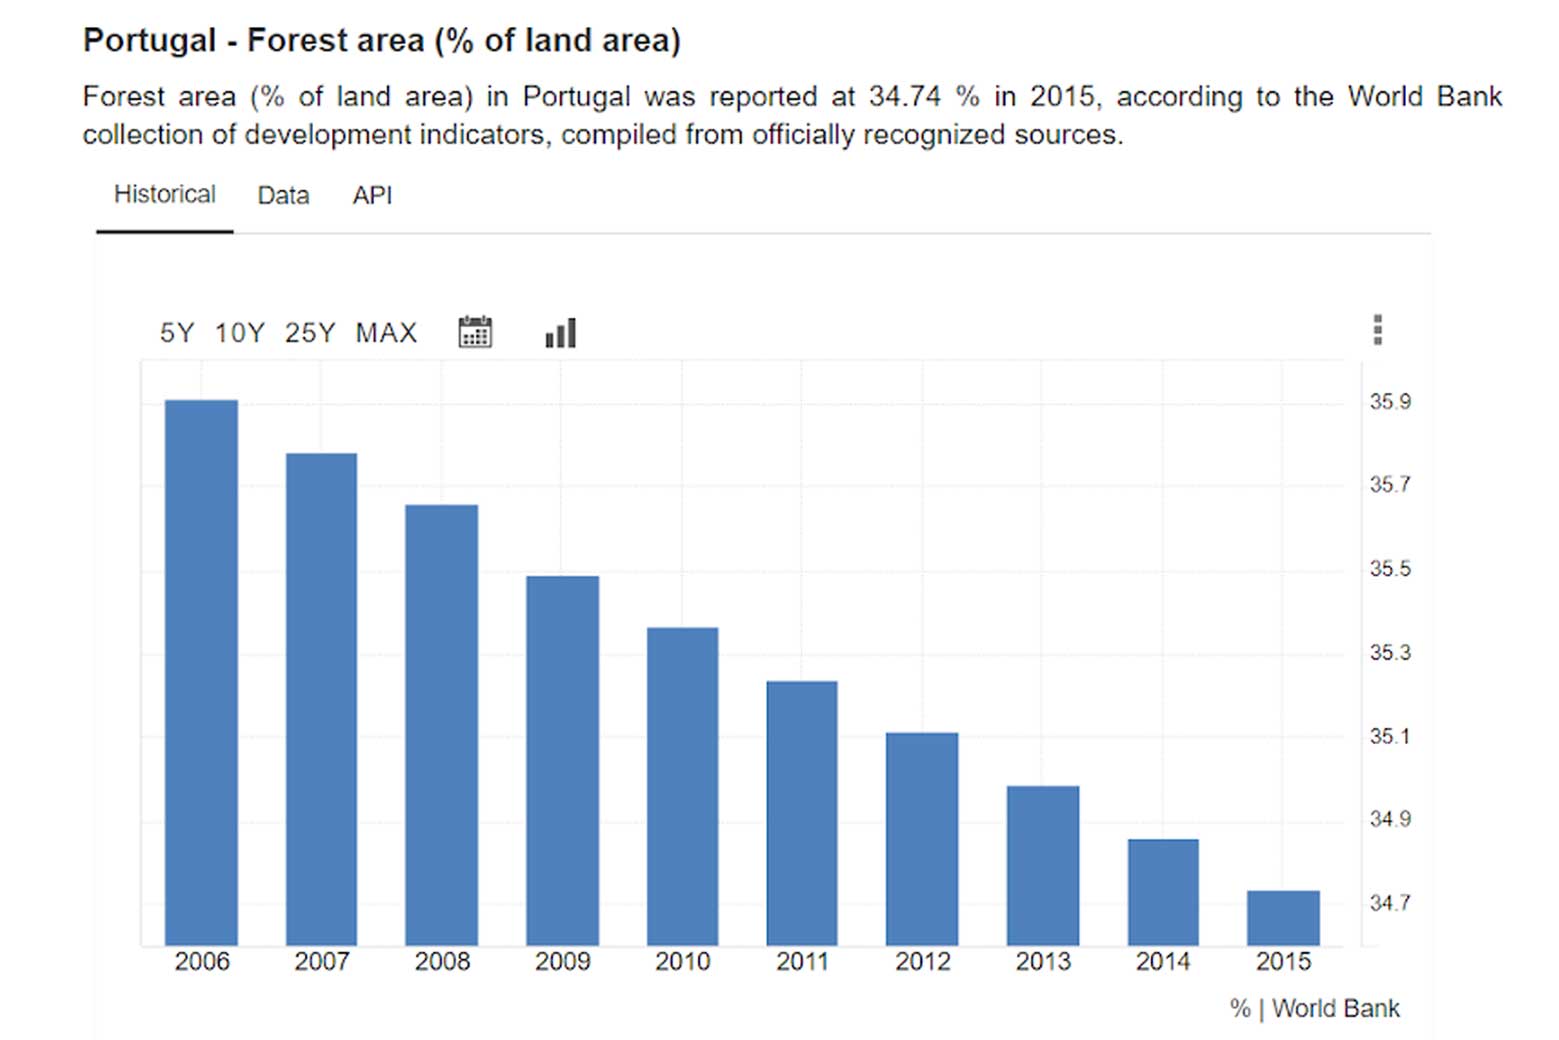
Deforestation
A study, conducted through the University of Bern’s Centre for Development and Environment, discerned the direct links between inequality of income, land and wealth; agricultural developments; and the expansion of farmland which causes deforestation.
This link is less visible in Portugal which has one of the largest proportional forest areas of the EU, representing 39% of the territory. This is most likely because the forest sector is of significant importance in the Portuguese economy, representing 2,1% of GDP and employing around 100 000 people. Nevertheless, the graph shows that the forests are in decline since 2006: